Home
Project
  • README
  • Orientation
  • Compass
  • Product Identity
  • Roadmap
  • System Model
Modeling
  • Methodology
  • Logical Space
  • Physical Space
  • Technical Space
  • Facet
  • Variability
  • ORE Studio Model
  • C++ Technical Space
  • SQL Technical Space
  • Other Tech Spaces
  • Variability Model
Developer
  • Guide
  • Recipes
  • Agile
  • LLMs
  • Prototypes
Resources
  • Manuals
  • Knowledge
  • Knowledge Graph
Downloads
ORE Studio

Enterprise-grade risk analytics —
but visual and open-source.

ORE Studio wraps the Open-Source Risk Engine (ORE) and QuantLib in an intuitive graphical interface - no Python or C++ required - built on a PostgreSQL-native, C++-performance backend.
Explore on GitHub Download
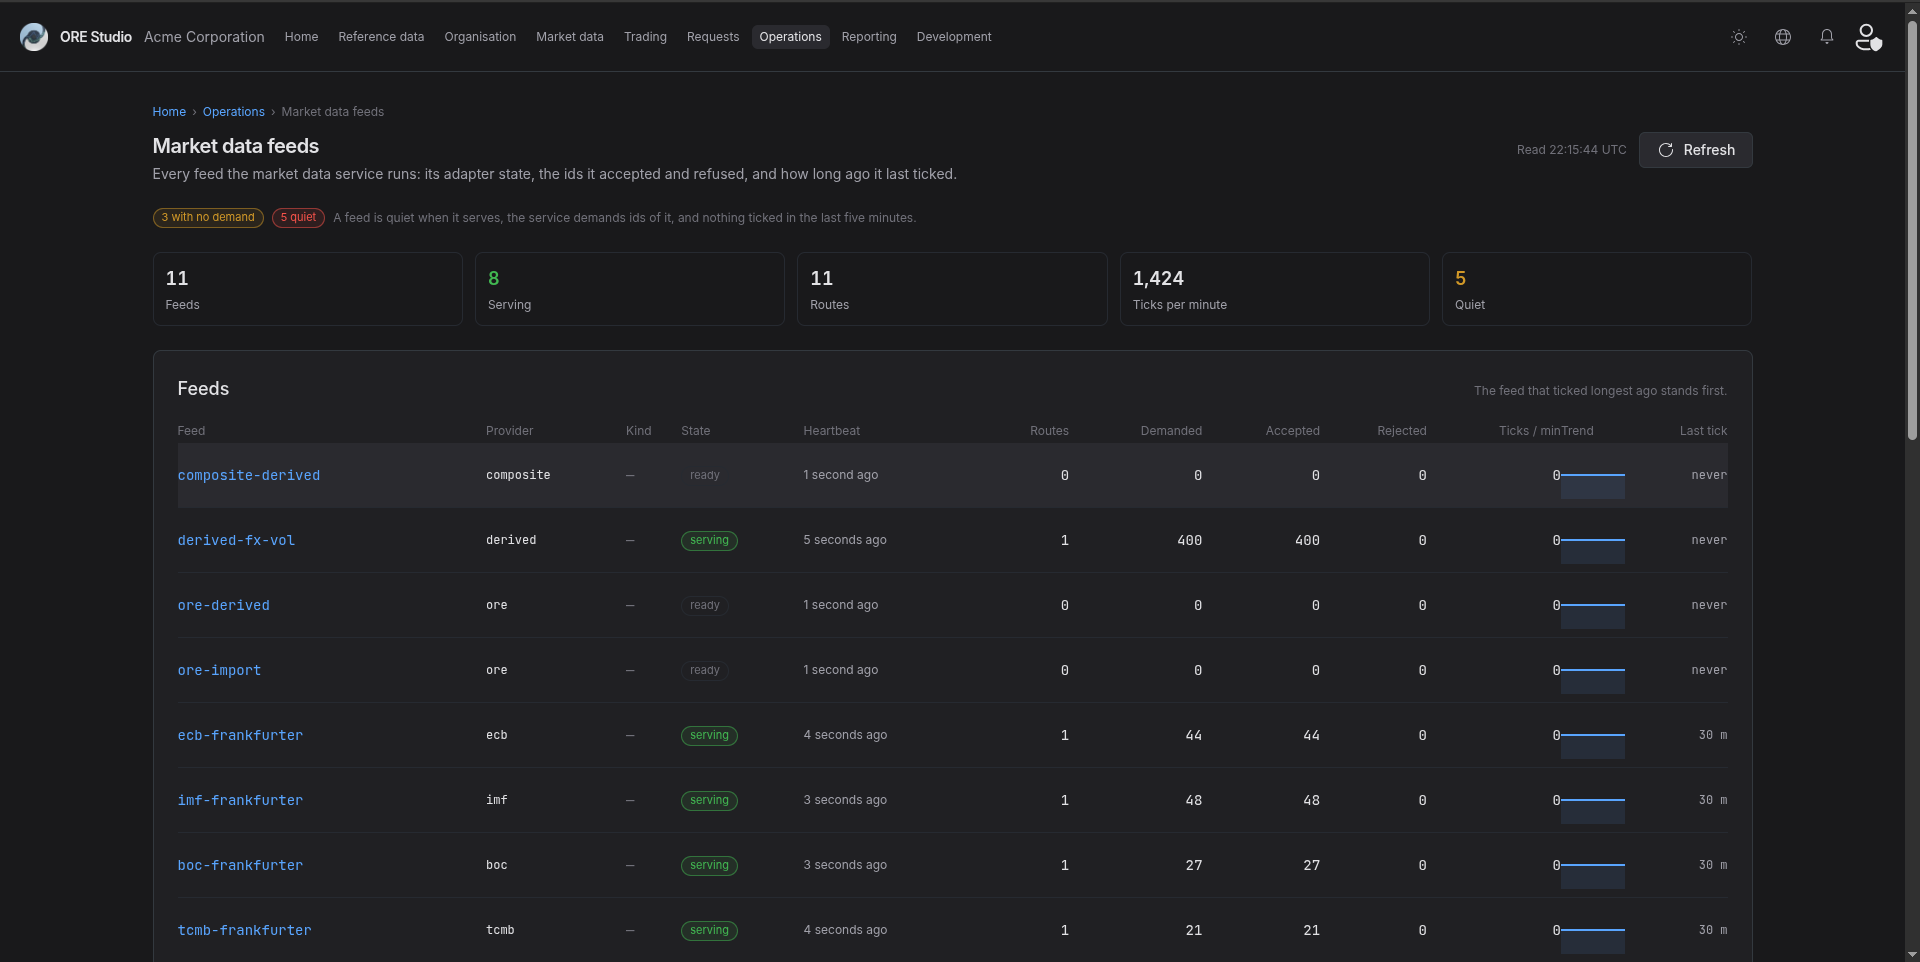
Market Data Feeds
Operations DashboardSee tenants, services, the compute grid and the message queue at a glance, with a status for each.
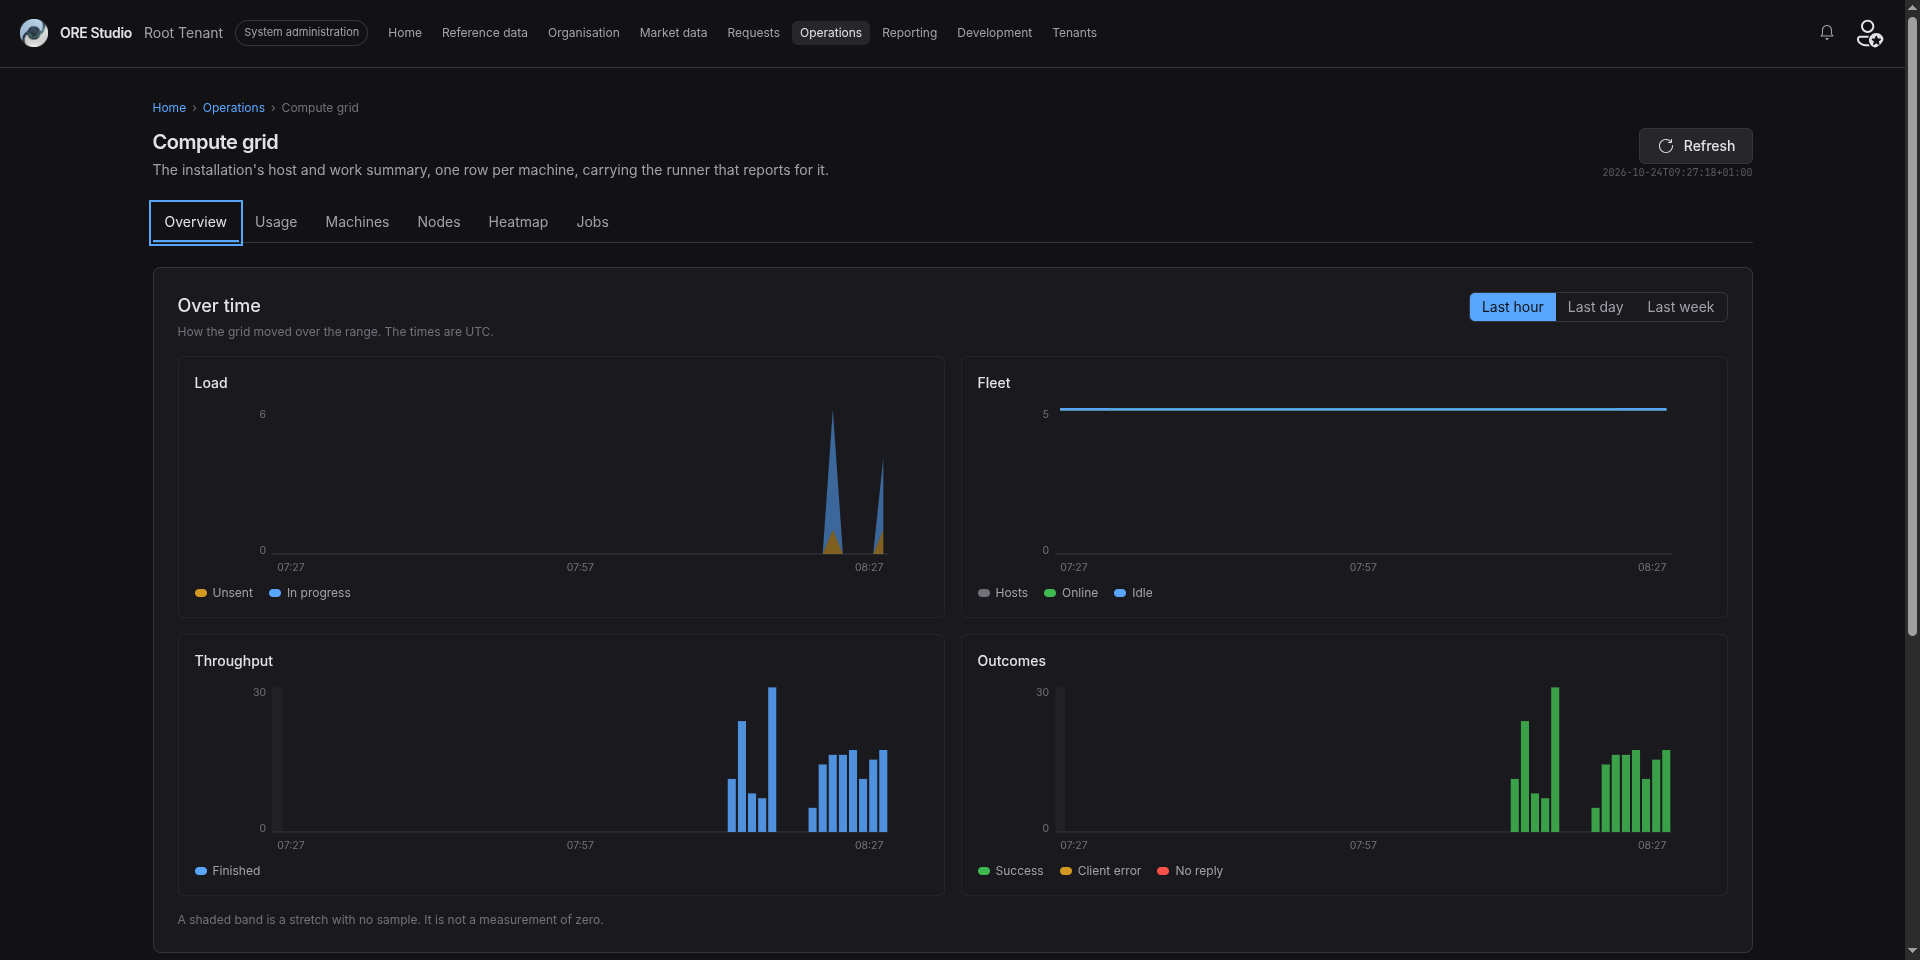
Compute Grid Overview
Compute GridWatch the load, the fleet, the throughput and the outcomes of the grid over the last hour, day or week.
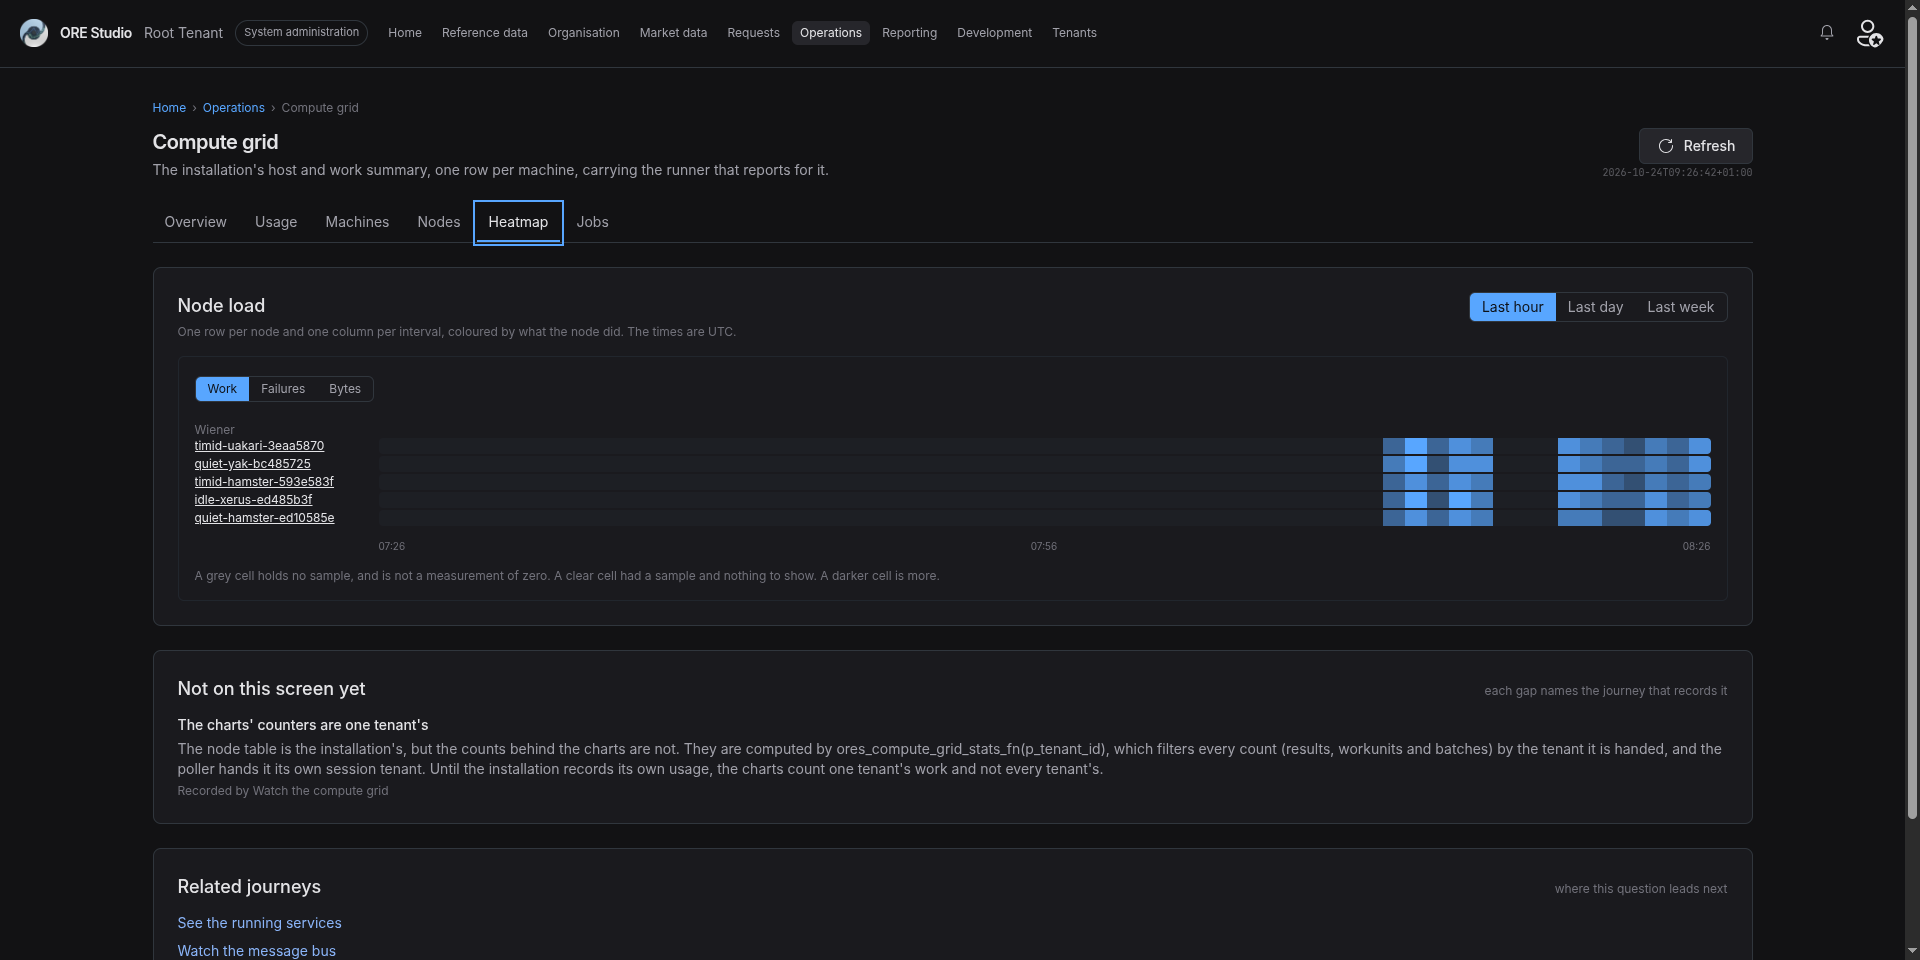
Compute Grid Node Load
Node LoadSee what every node did in every interval, with work, failures and bytes on a heatmap.
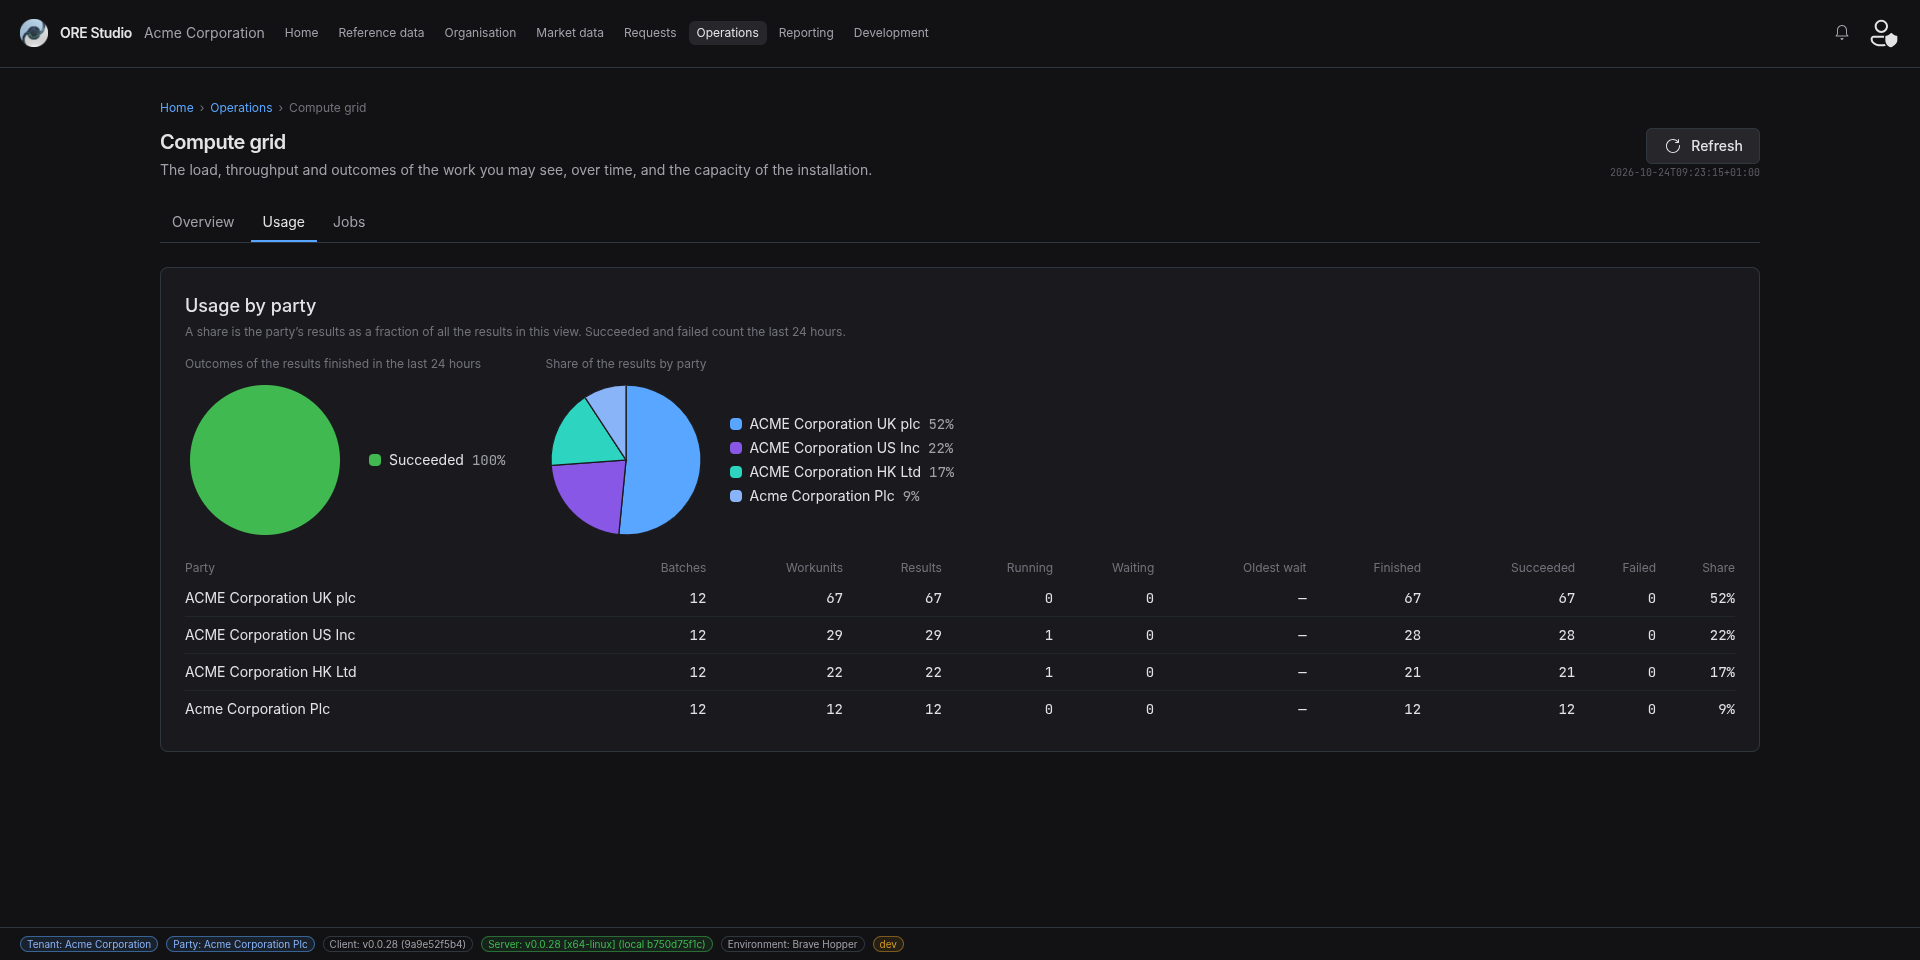
Compute Grid Usage by Party
Usage by PartySee each party's share of the grid's work and how its results ended, as a chart and a table.
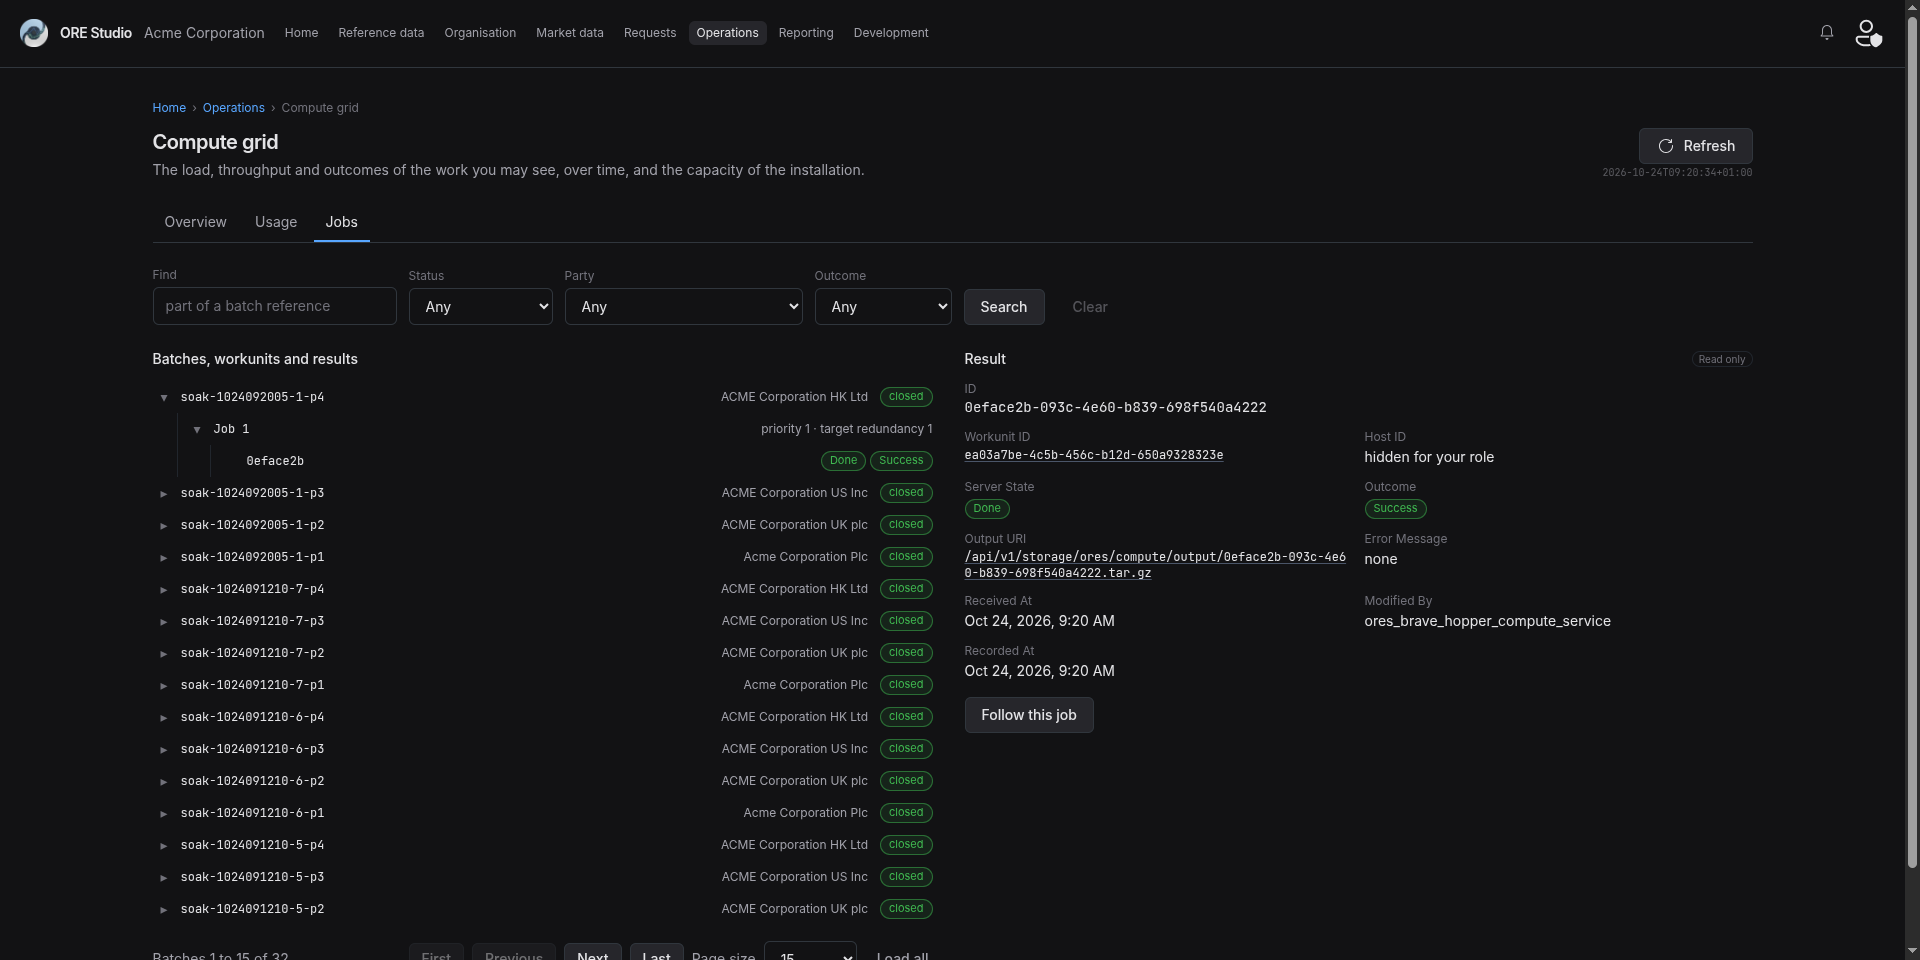
Compute Grid Jobs
Follow a JobOpen a batch, its workunits and its results, and follow a job from its dispatch to its output.
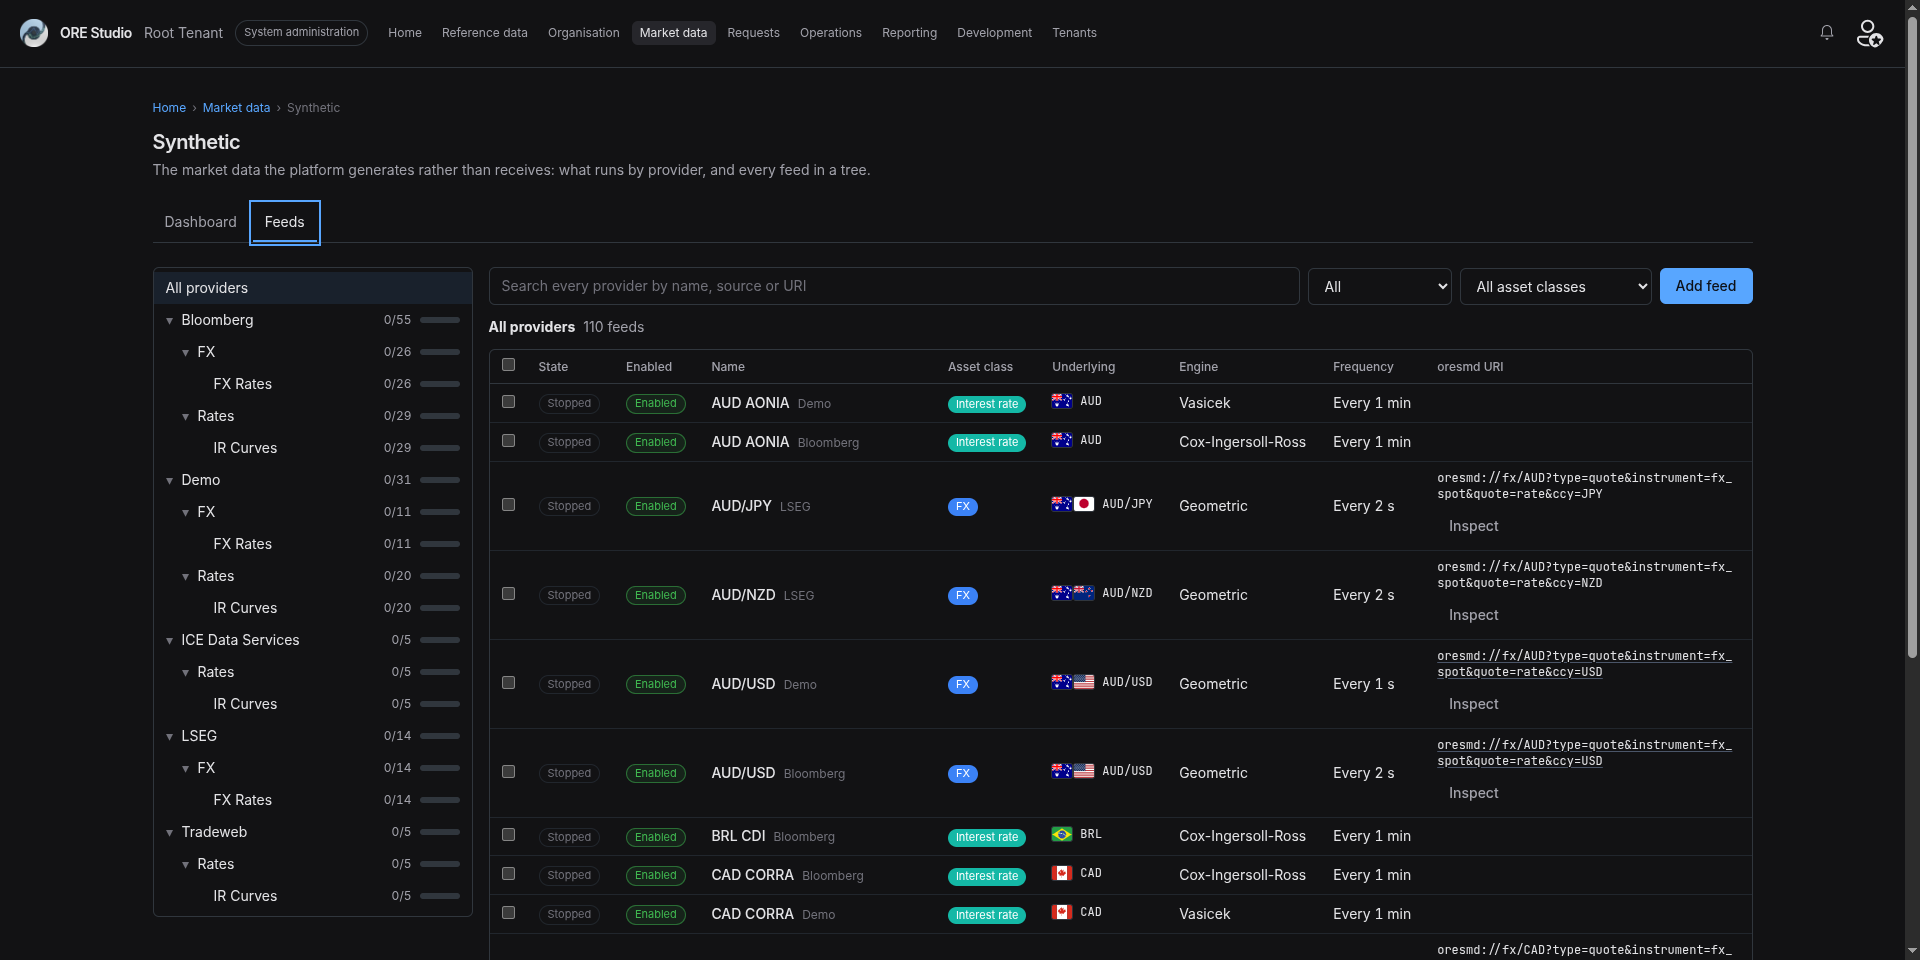
Synthetic Feeds
Synthetic FeedsBrowse every synthetic feed by provider and asset class, with its state, engine, frequency and oresmd URI.
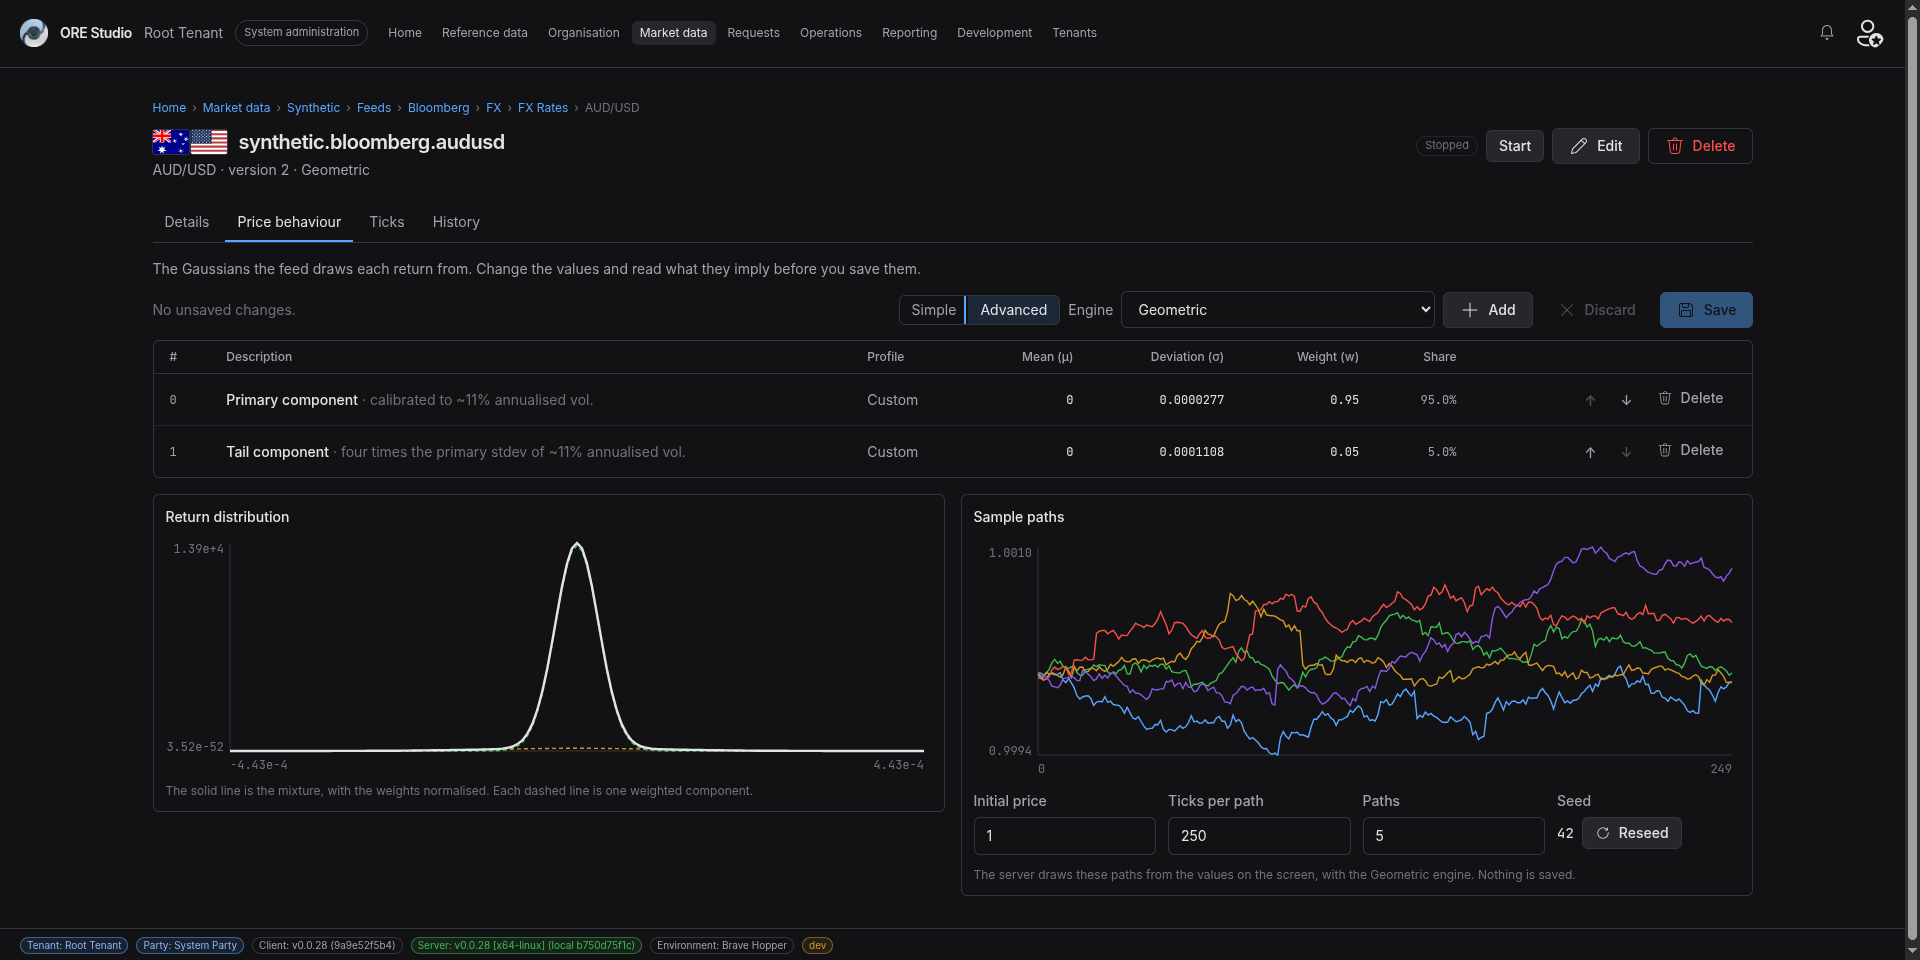
Synthetic Price Behaviour
Price BehaviourShape the price behaviour of a synthetic feed and read the returns it implies before you save.
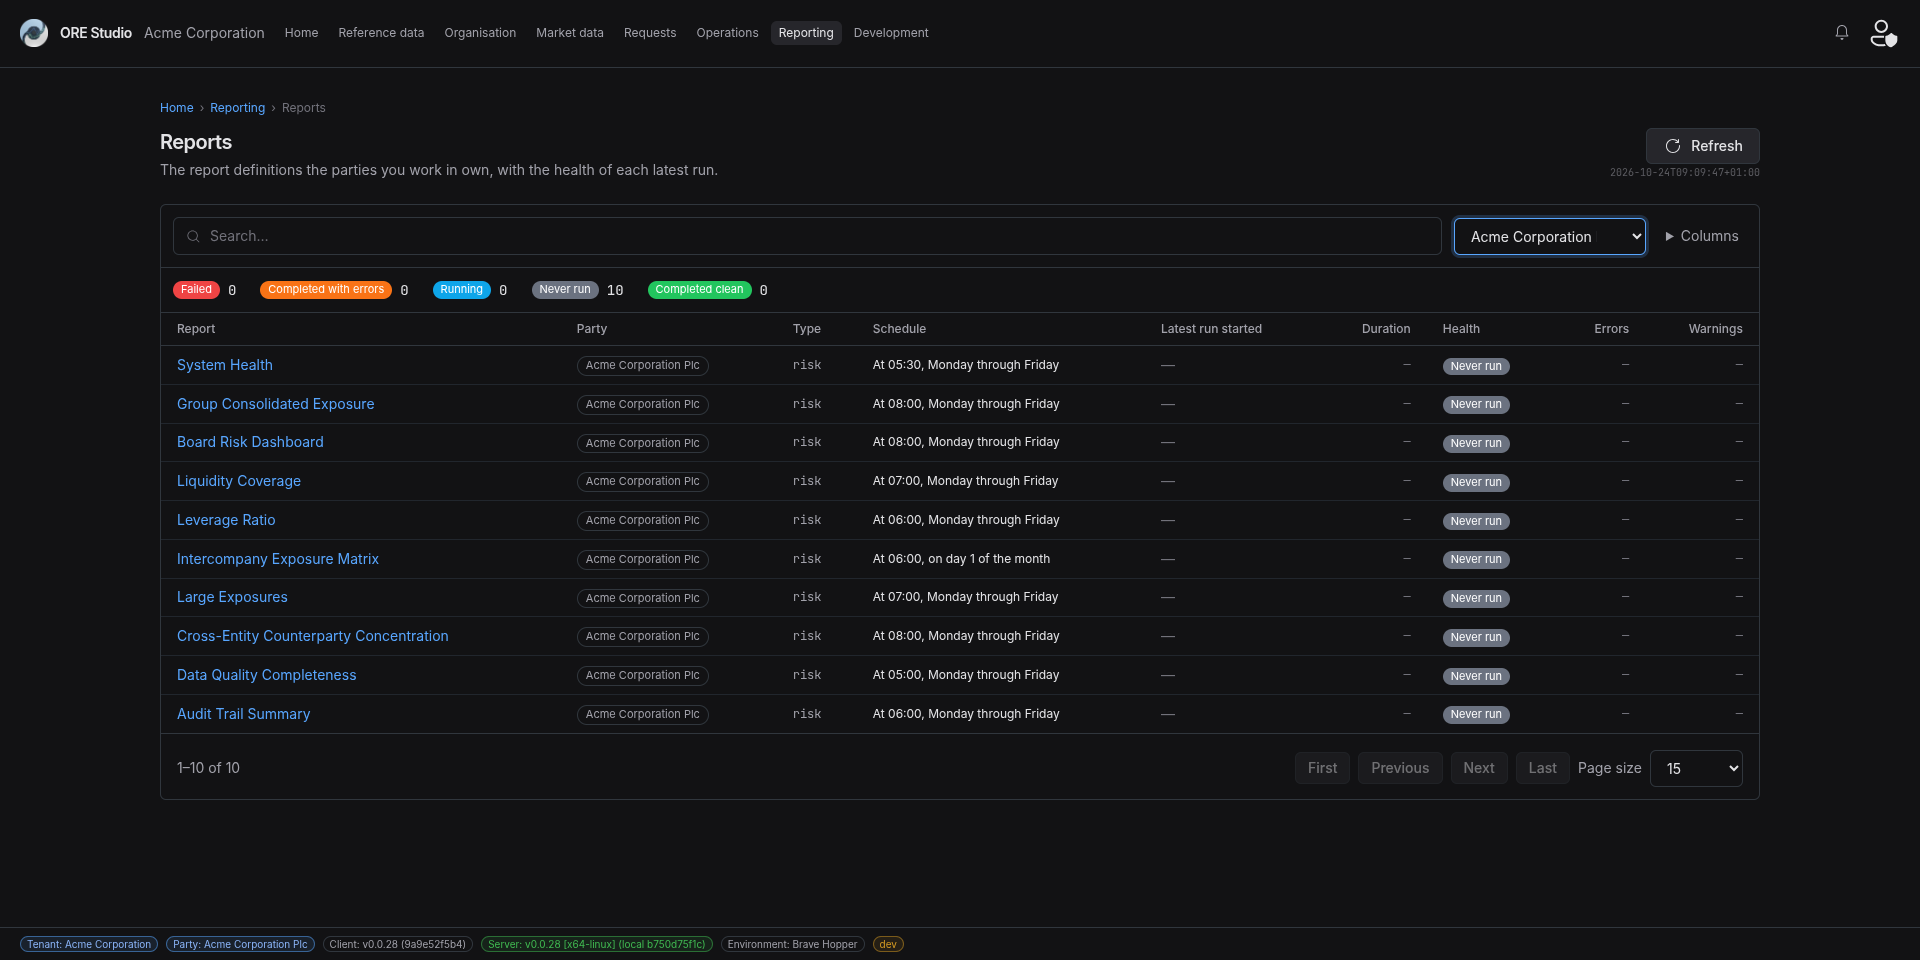
Reports
ReportsSee the reports a party runs, when each is scheduled and the health of its latest run.
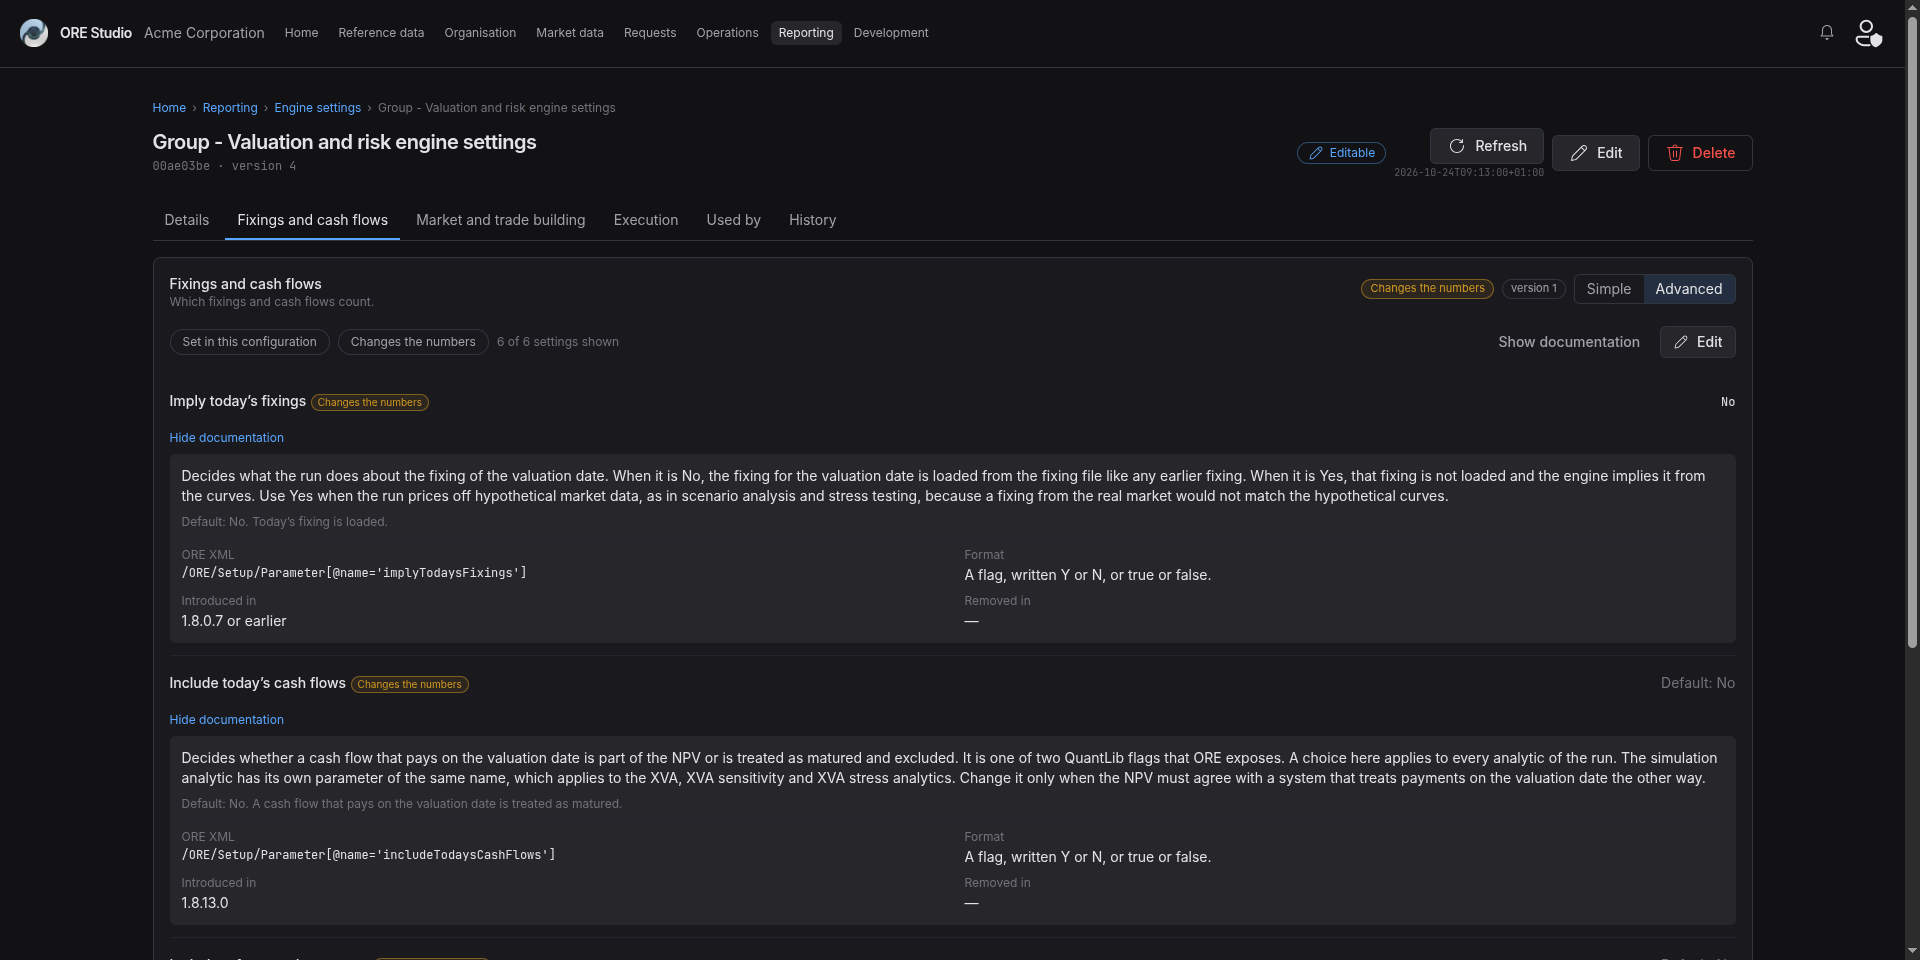
Engine Settings
Engine SettingsRead what each ORE setting does and where it came from, and change it for the party that owns it.
© 2026 ORE Studio contributors.