User Journey: Watch a curve or surface evolve
Table of Contents
This page documents a user journey: A market data consumer watches how one curve or surface changed over time, reading one instant or a range and naming the nodes that appeared or dropped.
A user journey describes what one person is trying to do, before anything is built. It is a design document that outlives any sprint, so it names the screens, the entity fields each screen shows, and the operations and messages each step needs.
1. Goal
"I want to see how this curve or surface moved, so I can tell whether today's shape is where it should be." The journey is done when the consumer has read one instant, has read a range at the zoom they need, can name the nodes that appeared or dropped between two instants, and can tell a curve built from one market state from a curve stitched across several.
2. Actor and trigger
The actor is the market data consumer: a signed-in person inside their tenant
who holds a market data read permission. No role is called consumer today;
read comes from the market data read permissions, such as
marketdata::market_series:read or marketdata::*. The trigger is a question
from a desk about a move, a report that looks wrong, or a curve the person is
asked to judge. The journey starts at the market data series list, or at a
curve or surface link from a report or a pricing screen, and ends when the
person leaves the evolution view.
A curve and a surface are not types at the wire. A curve is one of the market
series the oresmd_uri names, and the screen is keyed by that URI: the
the three reads name the object by typed identity fields, not by a curve id. See What is missing.
3. Steps
- Choose the object. The person opens Market data and finds the series by
its
oresmd_uri, its subclass or its asset classes. The system lists the tenant's series: the URI, the subclass, the derivation kind, and the asset classes it belongs to. The person filters by subclass or asset class. - Pick an instant. The person picks an instant, or leaves the latest one.
The system resolves the latest observation per node at or before that
instant, so the screen holds one value per
oresmd_uri. Today the read answers for now only; see What is missing. - Pick a range and a zoom. The person asks for a range: a span of time and a step. The system resolves one snapshot per bucket, one every step, so the screen holds the curve at each boundary. Today the read ends at now and takes a step and a count, not a start and an end; see What is missing.
- Read how stale the snapshot is. Every point carries the instant it represents and the instant it was recorded, and the read states the instant it is relative to. The screen draws an age band per point, the oldest point's age, and the spread between the oldest and the newest. A term structure is drawn from points that rarely share one observation instant, so without this a plot of a composite reads as a single market state.
- Read the aligned view. The system lines the instants up by node, so each
row is one
oresmd_uriacross every instant and each column is one instant. The alignment is the screen's own: the read hands back each bucket's observations unaligned and with text values; see What is missing. - Name the added and dropped nodes. The person asks what changed between two instants. The system compares their node sets and labels every node that appeared or dropped, beside the value change per node. A node the series identity names but an instant does not carry cannot be told from a node that was never part of the shape; see What is missing.
- Compare two instants. The person selects two instants. The system shows them side by side, the signed difference per node, the added and dropped set from step 6, and each point's age beside its value, because a difference between two points recorded far apart is not a move in the market.
- Leave. The person goes back to the series list or to the report they came from.
The reads in steps 2, 3 and 4 are answered inside the reply. Step 4's age is measured from the read's own instant and from the reader's clock in no case: the reply states the instant it is relative to, so clock skew cannot show up as staleness that is not in the curve. The journey carries no state of its own; leaving it and returning re-reads the series.
4. The staleness threshold
Two ages are readable from a point and they answer different questions. Market staleness is the read's instant minus the point's instant: the age of the market state the point belongs to. Record staleness is now minus the point's record time: how long ago the value arrived. The spread is the oldest market age minus the newest, and it is the spread that measures the mixing, because points that share one instant have a spread of zero however old that instant is.
The threshold is half an hour of spread. A spread of 30 minutes or more is a warning: the screen says the curve is stitched across market horizons rather than one market state, and it draws the per-point ages beside it instead of the plot alone. Below 30 minutes the screen says the curve reads as one market state. The number is where it is because the feeds behind a stitched curve publish within minutes of each other at worst, so half an hour cannot be produced by one publication round: a curve at or over it is built from at least two.
The read reports the crossing and nothing more: warning is set when the spread
is at or over the threshold, and the screen decides what to draw. A client that
wanted its own threshold could not enforce it, because only the read knows the
instant the ages are relative to.
5. Screens and wireframes
One screen. The object and the time control sit at the top, the aligned grid of instants by nodes sits in the middle, and the added, dropped and two-instant comparison sit at the bottom, so the person reads the object, then the range, then what changed.
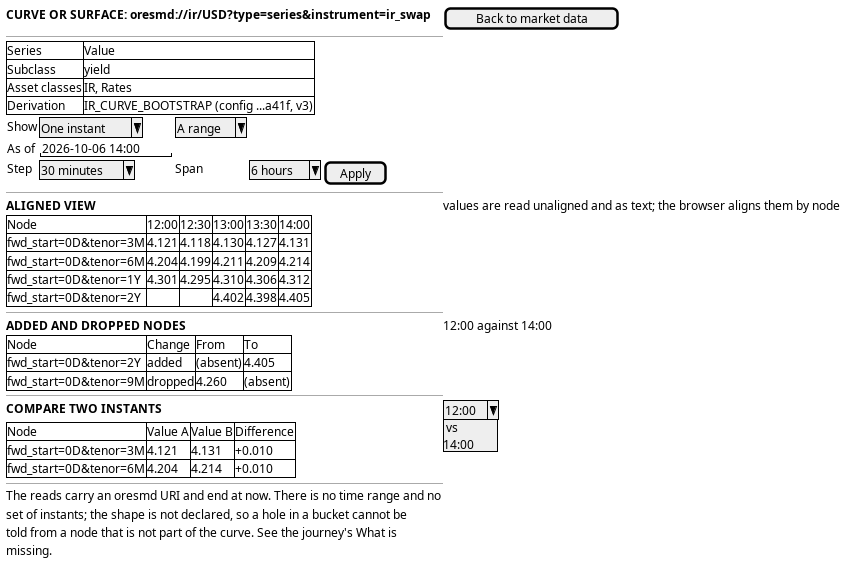
Figure 1: Curve evolution: the series and its time control, the aligned grid of instants by nodes, and the nodes that appeared or dropped between two instants.
6. Prototype
A static page at doc/prototypes/market_data/watch-a-curve-or-surface-evolve/index.html: mock data only, no backend,
no build step and no session. It argues that one instant and a range are the same view at different zoom: the alignment and the added and dropped nodes are the argument.
- Variants
- a the matrix of instants by nodes, b a per-node sparkline list, c a two-instant compare
- States
- stable, churn, surface;
?show=picks one instant or a range - Staleness
- every panel carries an age band per point, the oldest point's age and the spread; the
stablemarket is a curve read from one instant and thechurnandsurfacemarkets are stitched across market horizons, so switching between them shows the warning appearing at the threshold above - Source
doc/prototypes/market_data/watch-a-curve-or-surface-evolve/index.html- Open
/OreStudio/doc/prototypes/market_data/watch-a-curve-or-surface-evolve/once the site is built, or the file directly
7. Entities composed
| Entity | What it contributes | Model |
|---|---|---|
market_series |
The object chosen: the oresmd_uri identity, the subclass, and the derivation kind that marks a derived series |
ores.marketdata.market_series |
market_observation |
Each point at each instant: the point's oresmd_uri, the observation time, the value as text, and the source |
ores.marketdata.market_observation |
observation_lineage |
Marks a derived point and names the config, the version and the source as-of behind it | ores.marketdata.observation_lineage |
market_series_asset_class |
The asset classes a series belongs to, for the picker and its filter | ores.marketdata.market_series_asset_class |
series_classification_rule |
How an ORE series type maps onto the subclass the picker shows | ores.marketdata.series_classification_rule |
The series is the identity. Every point is one market_observation row keyed
by its own oresmd_uri, and the point carries no tenors or axis of its own: its
coordinate lives inside the URI. A derived point is marked by an
observation_lineage row, and nothing on the observation itself says it was
derived.
8. Operations and messages
| Step | Operation | Subject | Status |
|---|---|---|---|
| Choose the object | List the series | marketdata.v1.market_series.list |
exists |
| Choose the object | Read one series | marketdata.v1.market_series.get |
exists |
| Choose the object | List a series' asset classes | marketdata.v1.market_series_asset_classes.list |
exists |
| Choose the object | List the classification rules | marketdata.v1.series_classification_rules.list |
exists |
| Pick an instant | Read the latest value per node, as of now | marketdata.v1.curve_snapshot.get |
partial |
| Read how stale the snapshot is | Read each point's instant, its record time and the spread | marketdata.v1.curve_snapshot.get |
exists |
| Pick a range | Read the object over a range or a set of instants | marketdata.v1.ops.get_series_evolution |
exists |
| Read the aligned view | Read the instants by nodes, aligned | marketdata.v1.ops.get_series_evolution |
exists |
| Read the aligned view | List the raw observations of a series | marketdata.v1.market_observations.list_by_series_id |
exists |
| Read the aligned view | Read one observation | marketdata.v1.market_observations.get |
exists |
| Read the aligned view | Read the lineage of a derived point | marketdata.v1.observation_lineages.get |
partial |
| Name the added and dropped nodes | Read each node's change over the range | marketdata.v1.ops.get_series_evolution |
exists |
| Compare two instants | Read the difference between two instants | no subject | missing |
The snapshot and the evolution reads name the object by typed identity fields, so the screen needs neither a URI nor the id the registry holds. Both return the same nodes. The snapshot returns one value per node with its age. The evolution returns instants by nodes in one round trip, each node carrying its change over the range. The lineage read is keyed by the lineage row's id, not by the observation, so the screen can read it only when it already has the id; see What is missing.
9. What is missing
Three of the gaps this journey was written against are closed by the aligned evolution read, and the list is now the three that remain.
- No as-of on the single-instant read.
marketdata.v1.curve_snapshot.getalways answers for now and carries no instant; only the range reads take a start and an end. The candidate is an as-of field on the get. Until then the screen offers the latest instant beside a range the caller states. - No typed identity in the picker. The series list filter takes ids only, so
the picker cannot ask the server for one
oresmd_uri; it lists the tenant's series and matches the URI in the browser. The candidate is a URI filter onmarketdata.v1.market_series.list, or a get by URI. Until then the screen pages the list and searches it. - No candidate-against-published marker. No field on an observation says whether it is the market's value or a published one, and no publish operation exists, so the evolution view cannot separate the two. The candidate is a published version or a published flag. Until then the screen reads the market's values and states that the published set is not distinguished.
Closed with marketdata.v1.ops.get_series_evolution: the range or set of
instants is a request field, the response is instants by nodes with each node's
declared labels, and the grid comes from the shape tables rather than from the
observations the read happens to find. What the read does not carry is the value
difference between two instants and the per-point ages; the matrix holds both
values, so the screen draws the difference itself.
10. Related journeys
- See who changed a curve, and when — when the move needs an explanation, not just a shape
- Watch the market and clear its exceptions — the raw quotes behind the curve, and the ones that failed
- Check a curve's fit — the candidate against the quotes it came from
- Inspect a surface's slices — the surface at one instant, when the shape matters more than the move
- Publish the approved set — the act that makes a candidate the object this screen reads