Distributed Tracing
Table of Contents
This page defines the service architecture pattern
Distributed Tracing in the pattern language.
Each request carries a trace id for the whole action and a span id for each hop,
and each hop records its span, so the tree of calls one action caused can be
rebuilt with its timings. In ORE Studio ores.telemetry models the trace and
span ids; no service uses them yet.
1. Also known as
- OpenTelemetry tracing, after the standard most implementations follow.
- W3C Trace Context, the header format:
traceparentandtracestate.
2. Context
An action fans out across services and workflow steps. A Correlation Identifier already lets a person find every log line of the action. They also need to know which call caused which, and where the time went.
3. Problem
How does a person see which service called which for one action, and how long each hop took?
4. Forces
- A flat set of log lines shows what happened, not who called whom.
- Clocks on different hosts differ, so timestamps alone cannot order hops.
- Every hop must take part, as with a correlation id.
- Recording every span of every action costs storage, so a deployment samples.
5. Solution
The origin starts a trace: a trace id for the action and a root span. Each call
carries the trace id and the caller's span id in the traceparent header. The
called service starts a span of its own whose parent is the caller's span, does
its work, and records the span with its start, end and outcome. Every log line
of the span carries the trace id and the span id. The spans of one trace, joined
by their parent ids, rebuild the call tree.
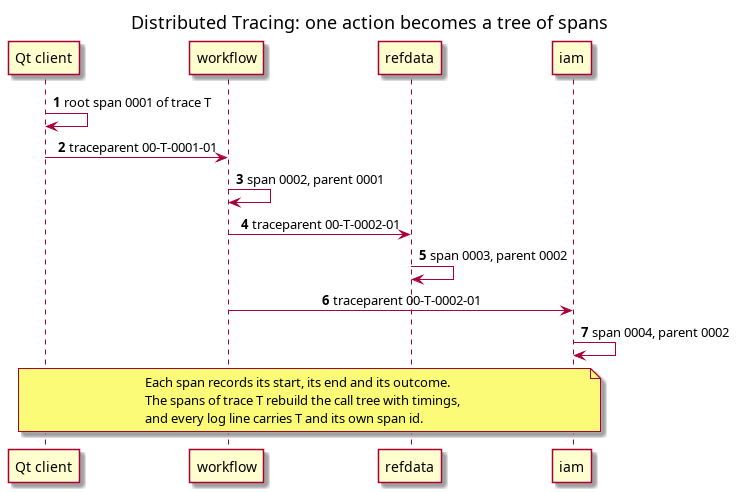
Figure 1: Distributed Tracing: the Qt client starts trace T, and each service starts a span whose parent is the caller's.
Source: [[./pattern_distributed_tracing.puml][pattern_distributed_tracing.puml]]. Regenerate with
plantuml -tpng doc/knowledge/service_architecture_patterns/pattern_distributed_tracing.puml.
The context a hop carries is small, and each hop leaves two kinds of record:
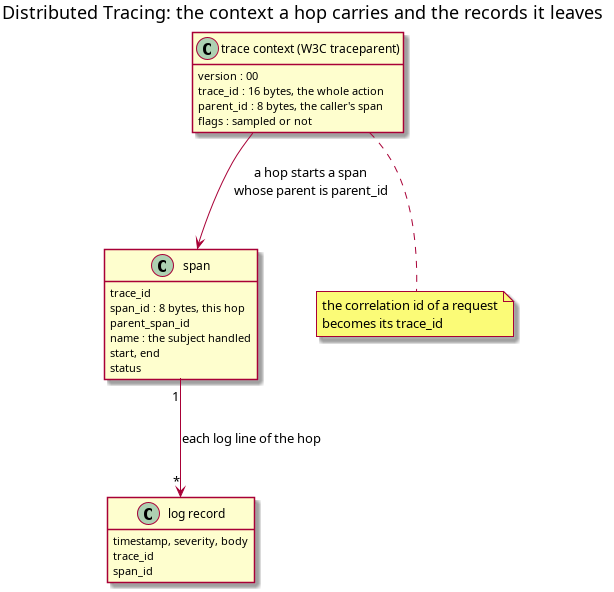
Figure 2: Distributed Tracing: the trace context on the wire, the span each hop records, and the log records that name both.
Source: [[./pattern_distributed_tracing_context.puml][pattern_distributed_tracing_context.puml]]. Regenerate with
plantuml -tpng doc/knowledge/service_architecture_patterns/pattern_distributed_tracing_context.puml.
6. Failure handling
| Concern | What the pattern does |
|---|---|
| Errors | A failed hop records its span with an error status and the error, so the trace shows where it failed. |
| Timeouts | The caller's span ends with a timeout status; the callee's span, if it ever ends, shows how late it was. |
| Retries | Each attempt is its own span under the same parent, so retries are visible as siblings. |
| Idempotency | Does not apply. Trace and span ids never deduplicate work. |
| Observability | This is the pattern's purpose: the call tree, the timings and the failing hop. |
7. Pitfalls
- A hop that does not propagate. Its callees start new traces, and the tree splits. The rule is the one for a correlation id: forward what arrived.
- Asynchronous work with no parent. A workflow step or an event consumer runs after the request has ended. It must take the stored trace context as its parent, or link to it, or it starts a tree of its own.
- Sampling decided per hop. If each service samples on its own, a trace has
holes. The origin decides, and the
flagsfield carries the decision. - A second id scheme. Running a correlation id and a trace id that differ makes two searches. Make the correlation id the trace id.
- An invalid trace id. W3C Trace Context forbids an all-zero trace id and an all-zero span id, so a generator must never produce either.
8. Security
Trace and span ids grant nothing. A span must not record secrets: tokens,
passwords, or the payload of a request. The tracestate header from outside is
untrusted and must be bounded.
9. Resulting context
- Benefits
- The call tree of an action, with the time of each hop and the hop that failed. Logs and spans join on the trace id.
- Liabilities
- Every service records spans and a collector stores them. Without sampling, the cost grows with every request.
10. In ORE Studio
- The model.
ores.telemetrydefinestrace_id,span_id,span_context,spanand alog_recordthat follows the OpenTelemetry log data model. - The plan. Tracing: OpenTelemetry identifiers across Qt and NATS
captures the work:
traceparentfrom Qt through every NATS hop, and a session id. - The first step. Follow a request across services from its logs carries a correlation id through every hop, shaped as a W3C trace id, so this pattern can reuse it.
11. Related patterns
- Correlation Identifier — the first step: the same propagation, with no tree and no timings.
- Scheduled Work Acting as a Tenant — a scheduled run is a trace whose root is the firing.
12. NATS patterns
The NATS service patterns hub states how each of these is written in
ores.nats code:
- Propagate the Correlation Id — the trace key as it travels on this bus today.
13. Sources
- Chris Richardson, Pattern: Distributed tracing, microservices.io.
- W3C, Trace Context, Recommendation — the
traceparentandtracestateheaders. - OpenTelemetry Tracing API specification and the Logs Data Model.
- Benjamin H. Sigelman et al., Dapper, a Large-Scale Distributed Systems Tracing Infrastructure, Google Technical Report, 2010.
14. See also
- Service architecture patterns — the structure note that orders this pattern language, and where to read this page in it.