User Journey: See the running services
Table of Contents
This page documents a user journey: A system administrator reads the services the installation runs: the expected roster, each instance's state and version, and when it last reported.
A user journey describes what one person is trying to do, before anything is built. It is a design document that outlives any sprint, so it names the screens, the entity fields each screen shows, and the operations and messages each step needs.
1. Goal
"I want to know what services this installation is running, and what is not reporting." The system administrator reads one screen and gets one row per instance the installation expects, grouped under its service. The journey is done when every row answers four questions: which service it belongs to, what state it is in, which version it runs, and when it last reported.
2. Actor and trigger
The system administrator: an account that holds the SuperAdmin role and acts
from the system tenant. The shell calls this context system administration
mode: the session's tenant is the system tenant, so every request it sends is
scoped to the deployment and not to a customer. A tenant administrator is
signed in inside their own tenant, and the shell offers them no Operations
area, so they cannot reach this screen; neither can any other signed-in
person, because the area rides the system-administration menu alone.
The trigger is doubt about the installation: a screen stopped answering, a deployment just started, or a build was rolled out and somebody asks whether every instance took it. The administrator opens the Operations area and reads the services screen. The journey ends when they have read what they came for.
This journey writes nothing. The screen reads samples that every service publishes on a timer, and the read changes no state.
3. Steps
- Open the services screen. The administrator opens the services screen in the Operations area. The system shows one screen: a summary line, a read-only table with one row per expected instance grouped under its service, and a refresh control. The administrator expects to find every service the installation runs, including the ones that are not reporting.
- Read the rows. The system gives each service its canonical name, for
example
ores.iam.service, and its instance count: how many of the expected instances reported, as four of four or four of five. Each instance row gives the instance id, a state word, the version, and how long ago the instance last reported. The state words are the installation's own: running, lost, missing. A lost instance keeps its row, so the absence of a row is never the answer. - Spot a version that lags behind. The version column exists for comparison: after a rollout, instances on different builds show different versions in one list. An older build is marked on its own row, and a lag that touches a service earns a notice of its own above the table, because a release only some instances took is the event this screen exists to catch. The heartbeat carries the release string only, so two builds of one release read the same here — see What is missing.
- An installation with none. The service is up but no heartbeat has arrived yet, which is the state right after a cold start. Every expected row says missing, and the summary says that nothing reported — rather than an empty table, which would read as an installation with no services.
- A service that went quiet. A service that stops reporting keeps its row, and the age in its last column grows. The roster read states it as lost: an instance that reported within the running window is running, one that reported earlier is lost, and a slot nothing fills is missing. The screen can state that an instance went quiet; it cannot say why, because a heartbeat cannot tell a service somebody stopped from one that fell over. The remaining gap is in What is missing.
- Refresh, or watch. The list is a point-in-time read, and heartbeats keep arriving while the screen is open. The administrator refreshes, or leaves the screen polling, so the ages in the last column move and a service that goes quiet is visible while they watch.
- Leave, or go on. The administrator leaves the screen, or follows one of the related journeys: the compute grid, the message bus, the logs, or the versions. The compute wrappers are the grid screen's: a wrapper runs on a node, and this screen leaves it with the node. A version column also raises the question the versions journey answers: which build the deployment itself runs.
4. Screens and wireframes
One screen. The summary line, the roster table and the refresh control are panels of that screen, because the administrator reads them as one answer. The screen is read-only: it creates nothing, changes nothing and destroys nothing.
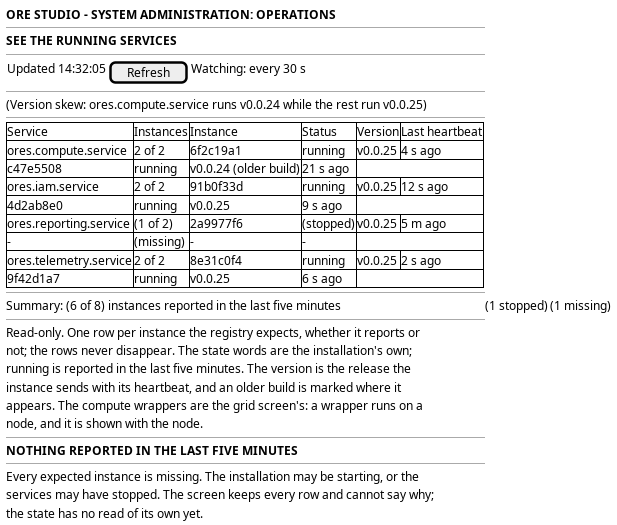
Figure 1: See the running services: the roster, the instance table and the missing state.
5. Prototype
Accepted by the user on 2026-10-04. The prototype is merged into main and
kept there as the record; the accepted commit names the state. The built screen keeps its
shape: one row per expected instance, grouped under its service.
- Accepted commit
285519db99, the tip ofprototype/operations-journeys, merged intomain- Source
doc/prototypes/operations/services/index.html- Open
/OreStudio/doc/prototypes/operations/services/once the site is built, or the file directly- Design record
- Task: Prototype the operations journeys
The prototype settled the roster. A lost instance never leaves the list: the row stays, the state changes, and the instance count reads four of five in the warning tone. The states use the installation's own words with the shell's colours — running in the accent tone, lost muted, missing in the warning tone. A version that lags behind is marked on its row and named in a notice above the table when it touches a service. The list sorts by service name, then slot, which the roster read orders once for every reader. The compute wrappers left this screen for the grid screen, where the nodes they run on are.
6. Entities composed
| Entity | What it contributes | Model |
|---|---|---|
service_sample |
State, instance id, host id, version and last heartbeat; one row per reporting instance | ores.telemetry.service_samples |
service_registry |
The expected roster: which services exist and how many replicas each runs | Service registry |
The row is the instance's latest sample, joined to the roster the registry
states. The samples serve "who is running"; the registry serves "who should
be". Neither alone is the screen: samples without the roster cannot show a
service that never reported, and the roster without samples cannot show a
version or an age. The registry is a code-generation model for the deployment
tooling, and codegen renders its expected services into
ores_telemetry_expected_services_tbl, which the roster read serves. The
heartbeat carries a host id, so a row can say which machine the instance runs
on.
7. Operations and messages
| Step | Operation | Subject | Status |
|---|---|---|---|
| Before the screen: every service reports on a timer | Publish that an instance is alive | telemetry.v1.ops.service_heartbeat |
exists |
| Open the screen | List the latest sample of every reporting instance | telemetry.v1.services.list |
exists |
| Read the roster | Read the services the installation expects and their replica counts | telemetry.v1.ops.get_service_roster |
exists |
| Read the rows | Read state, instance, version and sample time per expected instance | carried by telemetry.v1.ops.get_service_roster |
exists |
| A service that went quiet | Read an instance that went quiet, or never reported | carried by telemetry.v1.ops.get_service_roster |
exists |
| An installation with none | Answer one missing row per expected instance | carried by telemetry.v1.ops.get_service_roster |
exists |
| Refresh, or watch | Read the list again | telemetry.v1.services.list |
exists |
telemetry.v1.ops.service_heartbeat is ingested. Every service that embeds the
ores.service heartbeat publisher sends it on a timer with its name, its
instance id, its version and its host id, and the telemetry service timestamps
the receipt and stores it. The message is declared with auth none, because
the heartbeat carries no token.
telemetry.v1.ops.get_service_roster is served by the
service_samples model. Its
request carries no fields, because the reply covers the whole installation.
Its reply carries success, message and one slot per expected instance,
ordered by service name, then slot. Each slot carries the instance id, the
host id, the version and when the instance last reported, at any age, with its
state: running when it reported within the running window, lost when it
reported earlier, and missing when no instance fills the slot.
telemetry.v1.services.list remains the read of the samples themselves. Its
request carries no fields, and its reply carries success, message and one
sample per reporting instance. The read keeps the latest sample per
(service_name, instance_id) among the rows of the last five minutes, so it
answers active instances, not all instances.
The browser reads it through a hand-written BFF route, on the
journey runtime. No route serves
the operations screens yet; the prototype adds GET /api/operations/services,
which reads the list and marks each row's age. The handler authenticates the
caller's token and then checks telemetry::samples:read.
8. What is missing
- The roster has a read. Closed by
Serve the services roster: the
expected services come from the registry, codegen renders them into
ores_telemetry_expected_services_tblwith their replica counts, andtelemetry.v1.ops.get_service_rosteranswers one slot per expected instance. A service that never reports now shows as missing rather than absent. - The states have a read. Closed by Serve the services roster: the roster read supplies running, lost and missing, each with the last report at any age, so nothing is inferred from absence any more.
- Why an instance went quiet. An instance that reported and then fell quiet reads lost, because a heartbeat cannot tell a service somebody stopped from one that fell over — the state enum uses lost for exactly that reason. Telling the two apart is Record service starts and stops, which is still BACKLOG and would record a start and a graceful stop through the shared service lifecycle.
- The heartbeat states the release, not the build. Each service sends its
ORES_VERSIONstring, so two builds cut from one release look identical here, and a rebuild without a release bump is invisible. The candidate is for the heartbeat to carry the full version string — the one the login answer already states. - The heartbeat carries a host. Closed by
Carry the host on the heartbeat:
host_idsits on the heartbeat and on the stored sample, so a row can say which machine the instance runs on, and the grid's wrapper panel can place each wrapper on its node. - No uptime. Nothing says when an instance started, so the screen cannot tell an instance that just restarted from one that has run for weeks; the age of a heartbeat answers neither question. The candidates are a start time and a restart count on the heartbeat.
- The reply is ordered. Closed by Serve the services roster: the roster read orders its slots by service name, then slot, so the screen no longer sorts a reply that arrives in no particular order.
- The read checks a permission. Closed by
Serve the services roster:
telemetry.v1.ops.get_service_rosteris gated ontelemetry::samples:read, the permission the hand-written handler checks. The tree-wide gap the original item named (Nothing gates a hand-written operation handler) is not this read's alone.
9. Related journeys
- Watch the compute grid — the workers the services feed; a service that is up can still be failing its nodes
- Watch the message bus — the transport under every service; a service that went quiet may be a bus that went quiet
- Read the telemetry logs — a service that is up but failing: the lines say why
- Check the versions and the database — the deployment's build, next to the per-instance versions here
- Audit sign-ins — the sessions the services were answering; the legacy telemetry window showed both halves in one place
10. Related knowledge
11. See also
- User Journeys
- ores.telemetry Messaging Reference
- Expose the telemetry stats surface — the stored aggregates a screen of this family will want next