User Journey: Watch the message bus
Table of Contents
This page documents a user journey: A system administrator watches the message bus: the NATS server's health and each stream's stored messages over time.
A user journey describes what one person is trying to do, before anything is built. It is a design document that outlives any sprint, so it names the screens, the entity fields each screen shows, and the operations and messages each step needs.
1. Goal
"I want to know whether the message bus is healthy." The system administrator reads one screen and gets the NATS server's vitals and one row per stream. The journey is done when the administrator can say whether messages are moving, whether any consumer is slow, and whether a stream is growing without bound.
2. Actor and trigger
The system administrator: an account that holds the SuperAdmin role and acts
from the system tenant, in system administration mode. The shell offers this
screen in the Operations area, so a tenant administrator cannot reach it, and
neither can any other signed-in person.
The trigger is a symptom one level up: results are late, a service is quiet, or a stream is filling a disk. The administrator opens the bus screen and reads the vitals and the streams. The journey ends when the bus is accounted for, healthy or not.
This journey writes nothing. It reads samples that the telemetry service collects from the NATS monitoring API and stores.
3. Steps
- Open the bus screen. The administrator opens the bus screen in the Operations area. The system shows one screen: a vitals panel, a stream table with one row per stream, a time range, and a chart that follows the chosen stream. The administrator expects the bus the deployment is actually running, as the telemetry service sees it.
- Choose the range. The administrator sets the start and the end of the window. The reads answer the samples inside it — the start inclusive, the end exclusive — newest first, capped at the read's limit. Ten minutes answers a live question; a day answers an incident review.
- Read the vitals. The system states the newest sample's current numbers — client connections and the server's memory — and the movement across the range: inbound and outbound messages and bytes. Those four counters are running totals since the NATS server started, so the screen shows the difference between the samples at the ends of the range. The slow-consumer count reads the same way: a number that grows across the range is the event the screen exists to catch.
- Read the streams. The system gives each stream its name, the messages and bytes it currently stores, and its active consumers. A stream whose stored bytes only grow, with no consumer moving them, is the one to look at.
- Follow one stream. The administrator opens the chart for the chosen stream: messages and bytes over the range. The legacy client charted the queue it ran itself; the installation no longer runs a queue of its own, so the chart now reads the JetStream stream samples for the same question.
- No samples yet. The deployment is up but the range holds no sample: the telemetry service's poller has not made its first pass, the range predates it, or the poller stopped. The screen answers an empty range and says so. The poll runs on a timer, so the way to tell a stopped poller from a quiet bus is the services screen — see See the running services.
- Leave, or go on. The administrator leaves the screen, or follows the question behind the symptom: the services that publish, the grid whose results travel this bus, or the logs the bus carried.
4. Screens and wireframes
One screen. The vitals panel, the stream table, the range control and the stream chart are panels of that screen, because the administrator reads them as one answer. The screen is read-only: it creates nothing, changes nothing and destroys nothing.
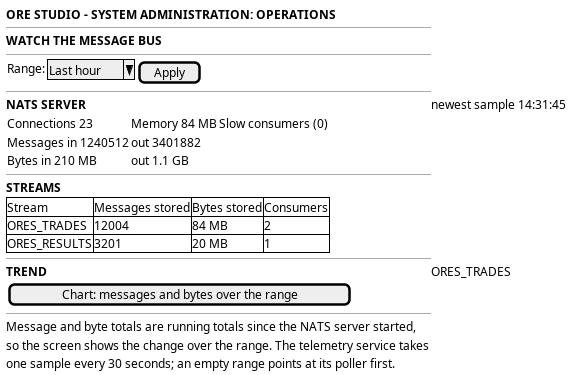
Figure 1: Watch the message bus: the server vitals, the stream table and the chart for one stream.
5. Prototype
Accepted by the user on 2026-10-04. The prototype is merged into main and
kept there as the record; the accepted commit names the state.
- Accepted commit
285519db99, the tip ofprototype/operations-journeys, merged intomain- Source
doc/prototypes/operations/message-bus/index.html- Open
/OreStudio/doc/prototypes/operations/message-bus/once the site is built, or the file directly- Design record
- Task: Prototype the operations journeys
The prototype settled the reading of a sample. The vitals keep the running totals apart from the current numbers and show the movement across the range as a difference, because a raw total says nothing without the sample it came from. The range control carries its rule in place — start inclusive, end exclusive — so adjacent ranges tile. The chart follows one chosen stream, as the legacy client's queue chart did, and reads the JetStream samples because the installation runs no queue of its own.
6. Entities composed
| Entity | What it contributes | Model |
|---|---|---|
nats_server_sample |
Connections, memory, message and byte totals, and slow consumers | ores.telemetry.nats_samples |
nats_stream_sample |
One row per stream: stored messages, stored bytes and active consumers | ores.telemetry.nats_samples |
A sample is a point in time, not a state. The screen draws every rate from two samples, and the model states which fields are running totals since the server started and which are current at the sample time; the screen keeps the two kinds apart.
7. Operations and messages
| Step | Operation | Subject | Status |
|---|---|---|---|
| Before the screen: the service polls NATS and stores samples | (no subject: the poller reads the NATS monitoring API) | — | exists |
| Open the screen | Read the server samples in a time range | telemetry.v1.nats_server_samples.list |
exists |
| Read the vitals | Read connections, memory, message and byte totals, slow consumers | carried by telemetry.v1.nats_server_samples.list |
exists |
| Read the streams | Read one stream's samples in a time range | telemetry.v1.nats_stream_samples.list |
exists |
| Read the streams — the names to read by | List the streams that have samples | — | missing |
| Follow one stream | Read the chosen stream over the range | telemetry.v1.nats_stream_samples.list |
exists |
| No samples yet | Answer an empty list | carried by both reads | exists |
Both list subjects are served by the
nats_samples model. Each request
carries a query with a start, an end and a limit; the stream query adds the
stream name. Each reply carries success, message and the samples the query
selected, newest first. Nothing publishes these messages: the telemetry
service polls the NATS HTTP monitoring API on a timer and stores what it
finds. The endpoint and the interval are configuration, with
http://localhost:8222 and 30 seconds as the defaults.
The browser reads them through hand-written BFF routes on the
journey runtime. No route serves
the operations screens yet; the prototype adds GET /api/operations/bus,
which reads both lists and marks the running totals.
8. What is missing
- Nothing lists the streams. The stream read names one stream, and no read says which streams exist or have samples, so the table depends on names from somewhere else. The candidate is a read of the stream names present in the range, so the screen draws its own table.
- Rates are left to the reader. Every message and byte field is a running total since the server started, so each reader subtracts two samples to get a rate, and every reader must subtract the same way. The candidate is for the read to answer deltas or rates over the range beside the totals.
- The limit truncates in silence. The query carries a limit — 1000 by default — and no offset and no total. At the 30-second poll interval the limit covers about eight hours, so a week-long range answers the newest 1000 samples and says nothing about the rest. The candidates are paging, a total on the reply, or an explicit statement that the reply is capped.
- A slow-consumer count cannot name the consumer. The sample keeps a running count, and the monitoring API knows which connection is slow. The screen can show that slow consumers exist, not which ones. The candidate is per-connection detail on the sample, or a current count beside the total.
- The reads check no permission. The handlers authenticate the token and
then serve any signed-in account. The candidate is a dedicated permission
the model guards, as the tenant reads guard
iam::tenants:read. The gap is not these reads' alone (Nothing gates a hand-written operation handler).
9. Related journeys
- See the running services — the telemetry service is the poller behind these samples; an empty range starts there
- Watch the compute grid — the work and the results this bus carries; idle nodes and a busy bus is one situation
- Read the telemetry logs — the lines behind a slow consumer or a refused publish
- Check the versions and the database — the build on both ends of a connection that misbehaves