User Journey: Watch the compute grid
Table of Contents
This page documents a user journey: A system administrator watches the compute grid: how many nodes it has, how busy they are, how the work is going, and which compute wrappers report for those nodes.
A user journey describes what one person is trying to do, before anything is built. It is a design document that outlives any sprint, so it names the screens, the entity fields each screen shows, and the operations and messages each step needs.
1. Goal
"I want to know how the grid is doing." The system administrator reads one screen and gets one summary of the host fleet, one row per node, and the compute wrappers that report for those nodes. The journey is done when the administrator can say whether the grid is working, and which node is behind.
2. Actor and trigger
The system administrator: an account that holds the SuperAdmin role and acts
from the system tenant, in system administration mode. The shell offers this
screen in the Operations area, so a tenant administrator cannot reach it, and
neither can any other signed-in person.
The trigger is work in flight: a batch was submitted, a node was added, or results are late and somebody asks whether the grid is the reason. The administrator opens the grid screen and reads the summary and the nodes. The journey ends when the fleet and the work in it are accounted for.
This journey writes nothing. It reads a summary the service already stores and the latest sample of every node.
The grid belongs to the installation: every tenant's work runs on the same
hosts, and the samples describe the fleet, not a tenant's slice of it. The
node read serves the whole grid and is gated on compute::grid_samples:read,
so the permission decides who may see it
(The grid read is scoped to the session tenant).
The summary's counters are narrower than the node read — see What is missing.
3. Steps
- Open the grid screen. The administrator opens the grid screen in the Operations area. The system shows one screen: a summary panel, a read-only table with one row per node, a panel of the compute wrappers that report for those nodes, and a refresh control. The administrator expects every registered node, busy or idle.
- Read the summary. The system states the host counts — total, online and idle — and the work counts: workunits, batches and active batches. It adds the outcomes of the last day: successes, client errors and jobs that got no reply. The sample time sits beside the counters, because a summary without its age cannot be trusted: the counters mirror one stored sample, not a live count taken at read time. The counters are computed for one tenant, so the screen says whose they are rather than presenting them as every tenant's work.
- Read the nodes. The system gives each node its hostname and one row of measurements: tasks completed since its wrapper started, tasks finished since the previous sample, the failed task count, the mean task time, the slowest task, the bytes fetched, the bytes uploaded, and the seconds since the node last heartbeated. A node the operator should look at has a large number in the last column, or failures beside its completions.
- Read the wrappers. The system gives each compute wrapper its instance id, its state and the release it runs, and when it last reported — the same heartbeat the services screen reads. One wrapper runs on each node and takes the work that node runs, so the panel is the fleet's other half. The heartbeat carries the host id, so the panel places each wrapper on its node.
- A grid with no sample. The deployment is up but no grid sample is stored yet, which is the state before the sampler's first pass. The screen says it has no sample and shows the node table on its own, rather than presenting zero hosts as a fact about the fleet.
- A node that went quiet. The node table reads the most recent sample of every node, so a quiet node keeps its row and its seconds-since-heartbeat grows. This is the deliberate difference from the services screen: there a quiet instance keeps its row and its state says so; here the age in the last column is the state.
- Refresh, or watch. The summary and the nodes are point-in-time reads. The administrator refreshes, or leaves the screen polling while a batch runs, as the shell's own grid command can watch the grid.
- Leave, or go on. The administrator leaves the screen, or follows a node into the paths that are out of this story's scope: host maintenance belongs to the compute journeys. Related screens carry the rest: the logs explain a failure, and the message bus shows whether results are moving at all.
4. Screens and wireframes
One screen. The summary panel, the node table, the wrapper panel and the refresh control are panels of that screen, because the administrator reads them as one answer. The screen is read-only: it creates nothing, changes nothing and destroys nothing.
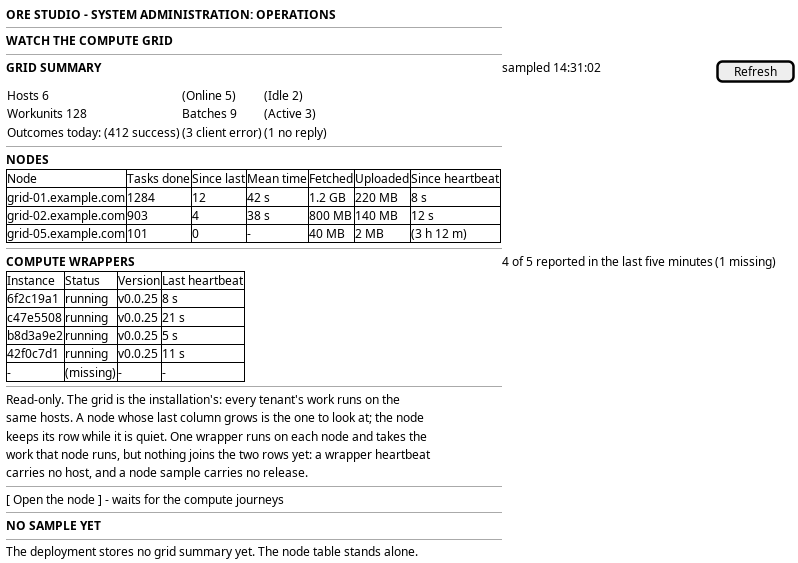
Figure 1: Watch the compute grid: the host and work summary, the node table, the wrapper panel and the empty state.
5. Prototype
Accepted by the user on 2026-10-04. The prototype is merged into main and
kept there as the record; the accepted commit names the state.
- Accepted commit
285519db99, the tip ofprototype/operations-journeys, merged intomain- Source
doc/prototypes/operations/compute-grid/index.html- Open
/OreStudio/doc/prototypes/operations/compute-grid/once the site is built, or the file directly- Design record
- Task: Prototype the operations journeys
The prototype settled the wrappers. They belong to this screen and not to the
services screen: a wrapper runs on a node and reports for it, so the panel
sits under the node table with the same four columns the services screen reads
— instance, state, release, last heartbeat — and the services screen leaves
the wrapper service out. It also settled the frame around the read: the grid
is the installation's, and the read serves it whole, gated on
compute::grid_samples:read, while the summary keeps its sample time beside
the counters because the counters mirror one stored sample.
6. Entities composed
| Entity | What it contributes | Model |
|---|---|---|
node_stats_summary |
One row per node: tasks, durations, bytes and seconds since heartbeat | ores.compute.telemetry |
grid_sample |
The host and work counters, as one stored sample with its time | ores.compute.telemetry |
host |
The hostname and display name joined onto each node row | ores.compute.host |
service_sample |
The wrapper instances that report for the nodes: state, instance id and release | ores.telemetry.service_samples |
The node row identifies its host by host_id, the host row's identity, and
nothing more. The hostname a person reads is the host's external_id, and it
arrives by joining the host list onto the summary. A node with no matching
host row shows its id and says no host names it.
The node rows and the wrapper rows describe the same machines. The node
sample carries host_id and no release, and the heartbeat carries host_id
beside the release, so the host id joins a wrapper to its node.
7. Operations and messages
| Step | Operation | Subject | Status |
|---|---|---|---|
| Before the screen: each wrapper reports on a timer | Publish one node's sample | compute.v1.ops.node_sample |
exists |
| Before the screen: the service samples the grid | (no subject: an internal poller stores the summary) | — | exists |
| Open the screen | Read the newest grid sample and the node rows | compute.v1.ops.get_grid_stats |
exists |
| Read the summary | Read the host and work counters | carried by compute.v1.ops.get_grid_stats |
exists |
| Read the nodes | Read one row per node | carried by compute.v1.ops.get_grid_stats |
exists |
| Name the nodes | Join the host registry onto each node row | compute.v1.hosts.list |
exists |
| Read the wrappers | List the latest sample of every wrapper instance | telemetry.v1.services.list |
exists |
| A grid with no sample | Answer with an empty sample time | carried by compute.v1.ops.get_grid_stats |
exists |
| Refresh, or watch | Read again | compute.v1.ops.get_grid_stats |
exists |
compute.v1.ops.get_grid_stats carries no request fields, and the handler
serves the whole grid's node rows, gated on compute::grid_samples:read. Its
reply carries the counters, the sample time as an ISO-8601 string, and one
node_stats_summary per node, each stating the node's failures and its
slowest task. The handler reads the newest stored grid sample and the most
recent sample of every node; it computes nothing live. The stored counters
were themselves computed per tenant, so the summary panel states whose they
are — see What is missing.
compute.v1.ops.node_sample is ingested. Each wrapper publishes what
its node did since the previous sample, and the message is declared with auth
none, because the publishing node has no session.
The wrapper panel reads telemetry.v1.services.list, the same read the
services screen uses, filtered to the compute wrapper service. The heartbeat's
host id joins each wrapper row to its node.
The browser reads the summary through a hand-written BFF route on the
journey runtime. No route serves
the operations screens yet; the prototype adds GET /api/operations/grid,
which reads the summary, joins the host list as the shell's own grid command
does, and reads the wrapper samples.
8. What is missing
- The grid is the installation's and the read serves the whole grid. Closed
by Read the whole grid: the
tenant filter is dropped from the grid reads, the stored tenant id stays as
attribution, and the read is gated on
compute::grid_samples:read, so the whole grid and who may see it stay two separate decisions. - A wrapper sits on its node. Closed by
Carry the host on the heartbeat:
host_idsits on the heartbeat beside the release and on the stored sample, so the panel joins each wrapper to the node it runs on. The screen states the release on the wrapper row; a node row could state it from the same join, and the accepted design leaves it where the prototype drew it. - The failures reach the screen. Closed by
Keep the failure fields on the node summary:
tasks_failedandmax_task_duration_mssit onnode_stats_summary, andget_grid_statsfills both from each node's newest sample, so a node failing every task no longer reads as a node doing nothing. - No history. The read answers with the newest stored sample only, so the screen cannot show a trend, and a batch's progress over time is not visible. The poller keeps writing samples that no read returns. The candidate is a read over grid samples in a time range.
- A node with no host row. Closed. The join fixes the common case, and the node table tags a node that no host names with "no host names it" instead of printing the id as if it were a name.
- The read checks a permission. Closed by
Read the whole grid:
compute.v1.ops.get_grid_statsis gated oncompute::grid_samples:read. The tree-wide gap the original item named (Nothing gates a hand-written operation handler) is not this read's alone. - The summary's counters are one tenant's. The node table is the
installation's, but the counters above it are not. They are computed by
ores_compute_grid_stats_fn(p_tenant_id), which filters every count — hosts, results, workunits and batches — by the tenant it is handed, and the poller hands it its own session tenant. The read that would make them the installation's own usage is the ledger Account for the grid's usage builds, and it is not built. Until it is, the screen states that the counters are computed for one tenant rather than presenting them as every tenant's work.
9. Related journeys
- See the running services — the services that feed the grid and poll it; a grid with no sample starts here
- Watch the message bus — the transport the work and the results travel on; a stalled bus explains idle nodes
- Read the telemetry logs — a node that failed a task: the lines say why
- Check the versions and the database — the build the deployment and its nodes run, when results look like yesterday's
10. Related knowledge
11. See also
- User Journeys
- Extract the ores.compute user journeys — the host, workunit and app screens behind this read-only view
- Extract the user journeys that replace the ores.qt screens