User Journey: Read the telemetry logs
Table of Contents
This page documents a user journey: A system administrator reads the telemetry logs: finds the lines that matter by time, level, source, component, tag or session.
A user journey describes what one person is trying to do, before anything is built. It is a design document that outlives any sprint, so it names the screens, the entity fields each screen shows, and the operations and messages each step needs.
1. Goal
"I want the lines that explain what happened." The system administrator reads one screen and gets the log entries a filter selects, newest first, with the total that match. The journey is done when the administrator has found the lines, or has established that the store holds none.
2. Actor and trigger
The system administrator: an account that holds the SuperAdmin role and acts
from the system tenant, in system administration mode. The shell offers this
screen in the Operations area, so a tenant administrator cannot reach it, and
neither can any other signed-in person.
The trigger is always a symptom: a batch lost results, a sign-in was refused, a screen showed the wrong figure. The administrator opens the logs screen to find the lines behind it. The journey ends when the lines are found, or when the empty answer is itself the finding — the system did not record the failure the operator is chasing.
This journey writes nothing. Reading lines changes no state; the store fills from the ingest path, which runs without a person.
3. Steps
- Open the logs screen. The administrator opens the logs screen in the Operations area. The system shows one screen: a filter bar, a read-only table of log entries and the count of matching rows. The screen starts on a recent range, so it opens useful rather than empty.
- Set the range. The system takes a start and an end. The start is inclusive and the end is exclusive, so adjacent ranges tile without overlap and no line lands in two windows. Every other filter works inside this range, and the range alone is often enough to shrink a store to a morning.
- Narrow the question. The system takes a level, or a minimum level for "warnings and worse"; a source, client or server; a source name, as the application calls itself; a component; a tag; and free text that must appear in the message. It takes a session and an account too, for the question that is about one person or one sign-in. The filters combine with AND: each one narrows, none widens.
- Read the table. The system gives each row its emission time, level, source, source name, component and message. The operator scans the levels and the components to find the moment the symptom began, then reads the lines around it.
- Open one entry. A row opens the full entry: its identity, the session and account it belongs to when it carries them, its tag, and the server's receipt time — which differs from the emission time when a batch of lines waited before it was published. The difference is how the operator tells a slow system from a slow report.
- Page. The read answers one page at a time, up to its limit, with a count of everything the filter matches. The screen reads "showing 1-100 of 2,431" and pages through the rest; the count settles whether the filter is narrow enough to read.
- Follow one sign-in. A session filter follows one sign-in across the components that logged for it. When the lines raise the question of who the session was, the path continues in Audit sign-ins, which holds the session's own record.
- Nothing matches. The filter is too narrow, the range holds no such event, or the store never received the line. The screen says the filter matched nothing and offers the way back: widen the range, drop a filter. It does not present the empty page as a failure.
4. Screens and wireframes
One screen. The filter bar, the entry table and the paging controls are panels of that screen, because the administrator reads them as one answer. The screen is read-only: it creates nothing, changes nothing and destroys nothing.
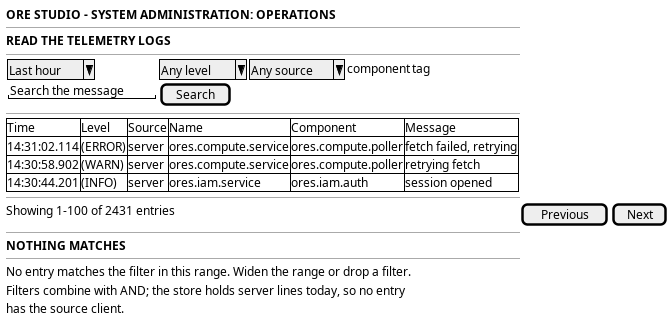
Figure 1: Read the telemetry logs: the filter bar, the entry table and the count with the paging controls.
5. Prototype
Accepted by the user on 2026-10-04. The prototype is merged into main and
kept there as the record; the accepted commit names the state.
- Accepted commit
285519db99, the tip ofprototype/operations-journeys, merged intomain- Source
doc/prototypes/operations/telemetry-logs/index.html- Open
/OreStudio/doc/prototypes/operations/telemetry-logs/once the site is built, or the file directly- Design record
- Task: Prototype the operations journeys
The prototype settled the reading of a page. The filters combine with AND and each one narrows; the bar keeps the range beside them, because the range alone is often enough to shrink the store. The table states the emission time and leaves the receipt time to the opened entry, where the difference between the two is the point. The paging line reads showing 1-100 of 2,431, so the count settles whether the filter is narrow enough to read.
6. Entities composed
| Entity | What it contributes | Model |
|---|---|---|
telemetry_log_entry |
Emission time, level, source, source name, component, message, tag, session and account | ores.telemetry.logs |
The entry is an event, not a versioned entity: it has an identity and a time, and nothing on the screen edits, deletes or reverts a line. The emission time belongs to the source and the receipt time belongs to the server, and the screen keeps the two apart.
7. Operations and messages
| Step | Operation | Subject | Status |
|---|---|---|---|
| Before the screen: a wrapper publishes engine logs in batches | Publish a batch of entries | telemetry.v1.ops.publish_log_entries |
exists |
| Open the screen | Read the entries a filter selects | telemetry.v1.logs.list |
exists |
| Set the range and the filters | Read the entries the query selects | carried by telemetry.v1.logs.list |
exists |
| Read the table and open one entry | Read every field of each selected entry | carried by telemetry.v1.logs.list |
exists |
| Page | Read one page and the total that match | carried by telemetry.v1.logs.list |
exists |
| Follow one sign-in | Read the entries of one session | carried by telemetry.v1.logs.list |
exists |
| Follow a client's lines | Read entries whose source is client | telemetry.v1.ops.publish_log_entries |
partial |
telemetry.v1.logs.list is served by the logs model. Its request
carries a query whose filter fields are all optional and combine with AND: a
range, a source, a source name, a session, an account, a level, a minimum
level, a component, a tag and free text for the message. Its reply carries
success, message, the entries and the total count.
telemetry.v1.ops.publish_log_entries is ingested and fire-and-forget. The compute
wrapper publishes batches of engine lines, and the telemetry service stamps
every ingested entry as a server entry and stores it. The message is declared
with auth none, because the publishing node has no session.
The browser reads the list through a hand-written BFF route on the
journey runtime. No route serves
the operations screens yet; the prototype adds GET /api/operations/logs,
which carries the filter from the screen.
8. What is missing
- The store holds no client lines. The query filters by source, and the only publisher is the compute wrapper, whose batches the service stamps as server entries. Nothing publishes client entries today, although the enum and the filter both support them. Until a client publisher exists, the screen must not offer a filter value that can never match.
- The filters are AND-only. There is no way to ask for one level or another, and no way to exclude a component. The candidate is a way to express a disjunction inside the otherwise conjunctive query.
- Nothing suggests filter values. The component, tag, source name and level are typed from memory, and a typo answers an empty page that looks like a quiet system. The candidate is a read of the values present in the range, so the screen offers the real components and tags.
- The message and component filters are built as SQL text. The query interpolates those two filters into LIKE patterns with a hand-written escaper, where every other repository binds its values (The telemetry log query escapes SQL by hand). This is a defect under the read, not a missing feature: bind the values before a screen leans on them.
- The stored aggregates have no subject. The database already computes hourly, daily and per-session statistics, and no read serves them (Expose the telemetry stats surface). A chart of line counts over time — "when did the errors start" — is the first thing an operator asks after the table.
- The read checks no permission. The handler authenticates the token and
then serves any signed-in account. The candidate is a dedicated permission
the model guards, as the tenant reads guard
iam::tenants:read. The gap is not this read's alone (Nothing gates a hand-written operation handler).
9. Related journeys
- See the running services — the component names in the lines are the service names on that screen
- Watch the compute grid — a task that failed: the grid gives the when, the logs give the why
- Watch the message bus — a refused publish or a slow consumer, as the bus saw it and as the lines recorded it
- Audit sign-ins — the session record behind a session id in the lines
- Check the versions and the database — a cluster of lines that matches a build: the versions screen settles which build a component ran
10. Related knowledge
11. See also
- Log Aggregation — the service architecture pattern this page states.
- User Journeys
- ores.telemetry Messaging Reference
- The telemetry log query escapes SQL by hand
- Expose the telemetry stats surface