User Journey: Diagnose and reproduce a failure
Table of Contents
+#+updated: 2026-10-07 +#+startup: inlineimages
This page documents a user journey: A signed-in person reads why a compute job failed, from its app version, package, command, inputs, exit code and stderr, and pulls the node's own logs, so the work can be run again locally.
A user journey describes what one person is trying to do, before anything is built. It is a design document that outlives any sprint, so it names the screens, the entity fields each screen shows, and the operations and messages each step needs.
1. Goal
"I want to know why this job failed, and I want to run it again on my own machine." The person opens one failed run and reads one screen: the failure rate around the run, which nodes and which app versions it clusters with, the job's full detail, the exact command the wrapper ran, the exit code, the stderr, and the lines the node recorded. The journey is done when the person can explain the failure and has the input bundle and the engine package to reproduce it.
2. Actor and trigger
The actor is what the rows admit, and the session decides the rows. A member sees their own run, a tenant administrator sees their tenant's, and the super administrator sees every run. That part of the journey does not split on the actor: the job's own detail is rows, and permissions and row-level security already describe the sets.
One control on the screen is withheld, and this is the one genuine boundary in the five journeys. A node's own logs are installation logs, and they may carry another tenant's inputs, so pulling them is a capability the super administrator holds and another tenant administrator does not. The job's own engine logs are not withheld: they belong to the job and carry its result id. The control for the node's logs is disabled for a non-super administrator and the screen says why. That is one control withheld, on the same screen, and it is not a second journey (Tenant ownership and the information flow).
The trigger is a run whose outcome is 3 ClientError or 4 NoReply, or a cluster of them on the failure charts. The person opens the run's detail and reads it until the failure is explained. The journey ends when the run is explained and the person holds what they need to reproduce it.
This journey writes nothing. It reads the failed run, its job, its batch, its app version, its node and the logs. It does not re-run the job, which the person does on their own machine with the shell.
3. Steps
- Find the failure. The person opens the failure screen from a failed run,
or from the failure charts. The system answers with the run and its job: the
run's
outcome, itserror_message, thehost_idit ran on, and theworkunit_idit belongs to. - Read the shape of the failure. The system draws the failure rate over time, so the person sees when it started; the failures by node, so one bad machine shows up; and the failures by app version, so one bad release shows up. The load heatmap, coloured by failures, places the failures on the grid.
- Read the job's full detail. The system states the job's batch and its
external reference, the workunit's
app_version_id,input_uriandconfig_uri, the run'sserver_state,outcome,error_messageandreceived_at, and the node's name. - Read the app version and the package. The system states the
wrapper_versionandengine_versionthe run used, and the per-platform package row of that version: itsplatform_id, itspackage_uriand itssha256. The person can verify the package they will run against the digest the grid verified (ores.compute.app_version, ores.compute.app_version_platform). - Read the command and the stderr. The system states the exact command the
wrapper ran. The wrapper writes the command line to its own process log as
Engine command: <exe> <args>, and captures the engine's stdout and stderr intoengine.log, which it publishes to the telemetry logs tagged with the run's result id. The engine's lines therefore carry what the engine said; the command line is not among them (Compute job lifecycle). - Read the exit code. The system states the engine's exit code. The result
carries no exit-code field; the wrapper writes it into
error_messageas "Engine exited with code N", followed by the tail ofOutput/log.txt. The screen reads it from there and says so. - Read the node's logs. The person presses the node logs control. A super administrator gets the lines the node recorded around the run. A non-super administrator finds the control withheld, and the screen says why: the node's logs are installation logs and may carry another tenant's inputs. This is the one control the actor dimension withholds.
- Reproduce it locally. The person downloads the job's input bundle with
compute download-inputand the engine package from itspackage_uri, checks the package againstsha256, extracts both, and runs the engine with the command from step 5 in the job directory. That is what the wrapper did (How do I download a compute job input from the shell?). - Nothing to explain. The run succeeded, the range holds no failures, or the failure belongs to another tenant. The screen says so and offers the way back. It does not present a flat failure line at zero as a quiet grid.
- Leave, or go on. A failure explained by a build continues in Keep what the grid runs. A failure explained by a busy or a lost node continues in Watch the grid. A failure the logs explain continues in Read the telemetry logs.
4. Screens and wireframes
One screen. The failure charts, the job detail, the command and stderr panel, the node logs control and the reproduce panel are panels of that screen, because the person reads them as one answer. The screen is read-only: it creates nothing, changes nothing and destroys nothing, and the one control it withholds is a read and not a write.
The panels are the charts Compute journeys names for diagnosing a failure:
| Panel | Chart | Answers |
|---|---|---|
| Rate line | Failure rate over time | When did it start? |
| Node bars | Failures by node | Is one node bad? |
| Version bars | Failures by app version | Is one release bad? |
| Node grid | The load heatmap, on failures | Where is it failing? |
The node grid is the same chart as the load journey's heatmap with a different metric, which is why the two journeys share it.
Every list on the screen pages on the server, per the Record screen standard. The evidence line lists, the node's own lines and the runs of the job each carry First, Previous, Next, Last, a page size and Load all, with the page and the page size held in the address. A new search, a new filter, a new order or a new page size returns to page one, and Load all is offered only when the server's total is 1000 or less. No list reads with a fixed large limit, and none pages to the end to show everything.
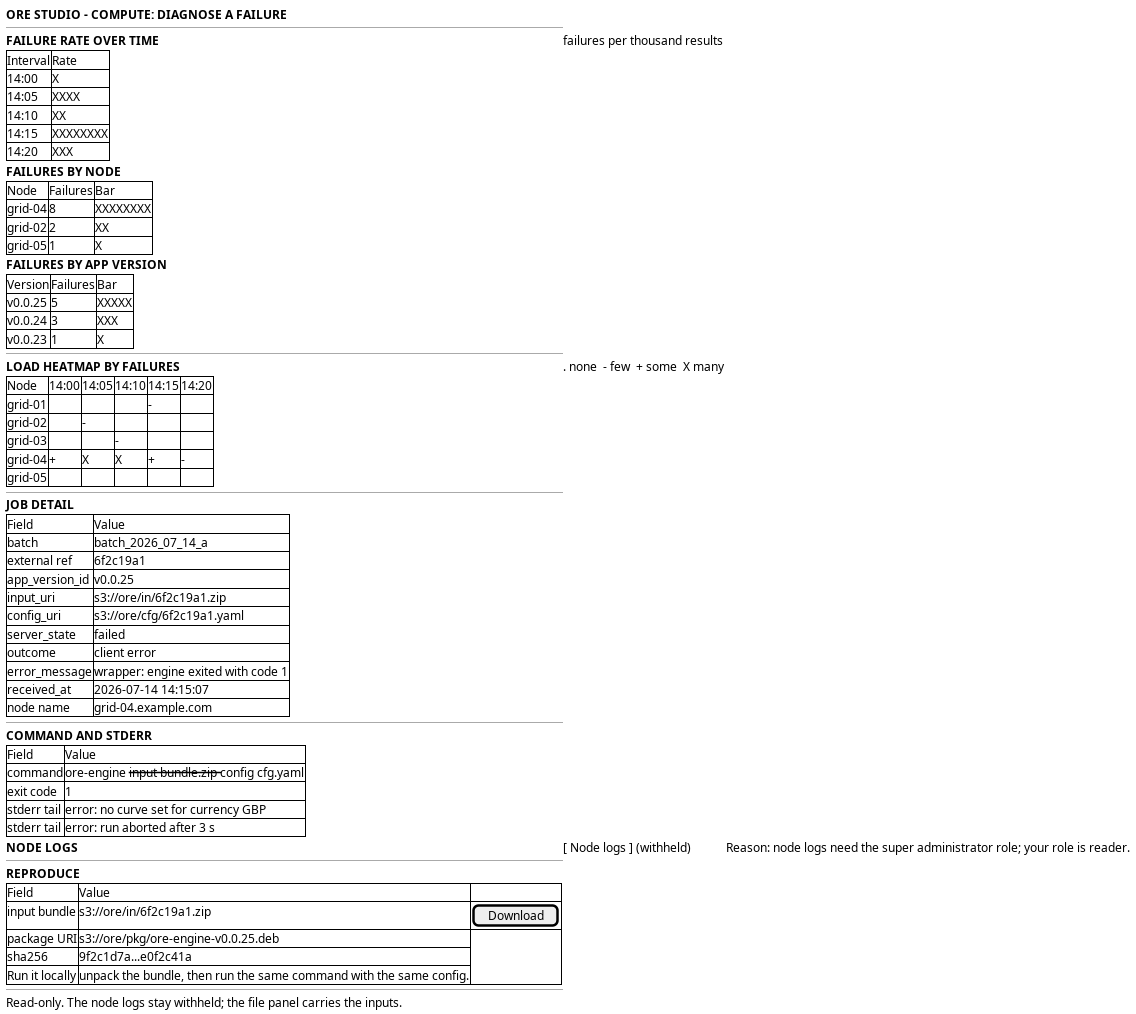
Figure 1: Diagnose and reproduce a failure: the failure charts, the job detail, the command and stderr panel, the node logs control and the reproduce panel.
5. Prototype
None. This journey is not built and has no clickable prototype. Its design record is the use-case analysis on Compute journeys.
6. Entities composed
| Entity | What it contributes | Model |
|---|---|---|
result |
The failed run: workunit_id, host_id, server_state, outcome, error_message, output_uri and received_at |
ores.compute.result |
workunit |
The job: batch_id, app_version_id, input_uri, config_uri and target_redundancy |
ores.compute.workunit |
batch |
The batch and its external_ref |
ores.compute.batch |
app_version |
The build the run used: wrapper_version and engine_version |
ores.compute.app_version |
app_version_platform |
The package for the run's platform: platform_id, package_uri and sha256 |
ores.compute.app_version_platform |
platform |
The triplet the package was built for: code, os_family and cpu_arch |
ores.compute.platform |
host |
The node the run failed on: external_id and display_name |
ores.compute.host |
telemetry_log_entry |
The engine's command line, its stdout and stderr, and the node's lines: timestamp, source_name, component, level, message and tag |
ores.telemetry.logs |
node_sample |
A node's interval, for the failure charts: tasks_failed and max_task_duration_ms |
ores.compute.node_sample |
The job's engine logs are found by their tag. The wrapper publishes both
engine.log and ORE's Output/log.txt to the telemetry logs with the run's
result_id as the tag, so the log read takes a tag filter and no host is
involved. The node's own logs carry no host id at all, which is why step 7 is
both withheld and, today, not directly answerable.
7. Operations and messages
| Step | Operation | Subject | Status |
|---|---|---|---|
| Before the screen: the wrapper runs the engine and submits the outcome | Submit one result | compute.v1.results.submit |
exists |
| Before the screen: the wrapper publishes the engine's lines | Publish a batch of log entries | telemetry.v1.logs.publish |
exists |
| Find the failure | Read one run | compute.v1.results.get |
exists |
| Find the failure | Read the runs of the job | compute.v1.results.list_by_workunit_id |
exists |
| Read the job's detail | Read one job | compute.v1.workunits.get |
exists |
| Read the app version and the package | Read the app versions and their platform rows | compute.v1.app_versions.list, compute.v1.app_version_platforms.list |
exists |
| Read the node | Read one host | compute.v1.hosts.get |
exists |
| Read the command, the stderr and the engine's lines | Read the log entries whose tag is the run's result id | telemetry.v1.logs.list |
exists |
| Read the node's own logs | Read the log entries of one node | (the entry carries no host id) | missing |
| Withhold the node's own logs | Check the caller's permission for a node's logs | (no dedicated permission) | missing |
| Read the failure charts | Read the failures by node and by app version over a range | (no aggregate subject) | missing |
| Read the failure charts | Read the grid samples in the range, coloured by failures | (no range read) | missing |
| Reproduce it locally | Download the job's input bundle | compute download-input |
exists |
| Reproduce it locally | Download the engine package | (no shell verb; storage HTTP only) | missing |
telemetry.v1.logs.list takes an optional tag, source, source name, component,
level, range, session and account, and its filters combine with AND. The job's
lines are read with tag set to the run's result id, which is what the wrapper
published them under.
compute.v1.results.submit is the trusted machine channel: a node holds no
user JWT, so the submit carries the result_id, host_id, output_uri,
outcome and error_message, and the service records them on the run.
The browser reads the screen through a hand-written BFF route on the journey runtime. No route serves a compute screen yet.
8. What is missing
- The exit code is prose, not a field. The result carries no exit-code
column. The wrapper writes "Engine exited with code N" into
error_message, so the screen reads a number out of a sentence. A dedicated field is the clean shape, and the tail ofOutput/log.txtbelongs beside it. - A node's logs cannot be pulled by node. The log entry carries a source, a source name, a component and a tag, and no host id. The job's own line stream is reachable by tag, and a node's wide line stream is not. A host id on the ingested entry, written by the publishing wrapper, is what the control needs. The same missing field is the permission boundary: the lines that would answer the question are the lines that may carry another tenant's inputs.
- No permission guards the node logs.
telemetry::logs:readexists in the seed, and the logs read checks no permission. Withholding one node's logs from a non-super administrator needs a code that names the node scope, and the read must check it (Nothing gates a hand-written operation handler). - The failure charts have no read. The failure rate, the failures by node
and the failures by app version are aggregates over a time range. A result
carries
host_idandoutcome, and a workunit carriesapp_version_id, so the rows the charts need exist, and no subject returns them over a range. - No package download verb. The wrapper downloads the engine package from
package_uriand verifies it againstsha256, and a person reproducing a failure has no shell verb for either. The input hascompute download-inputand the output hascompute download-output; the package has neither. The storage HTTP path works, and the journey must not pretend a verb exists. - A failed run writes no output archive. On a non-zero exit the wrapper
uploads nothing, so no archive exists at the run's
output_uri. The result still carries theoutput_urithe assignment pre-assigned to it: the wrapper initialises it from the event and always submits it, so the field is not empty and it names a URI with no file behind it. The screen must say the archive is absent and not present the field as a missing file. - The node summary drops the failure fields.
node_samplecarriestasks_failedandmax_task_duration_ms, andnode_stats_summarycarries neither, so the failures by node chart cannot be driven from the summary read (The node summary drops the failure fields).
9. Related journeys
- Watch the grid: the load and the node state the failure sat in
- Follow a job: the whole job, of which this failed run is one attempt
- Plan the grid's capacity: a failure explained by a node that could not hold the work
- Keep what the grid runs: a failure explained by a bad release
- Watch the compute grid: the fleet survey, where a node that went quiet shows first
- Read the telemetry logs: the search surface behind the job's and the node's lines
- Watch the message bus: a slow or refused publish that explains a late result
10. Related knowledge
- Compute journeys: the use cases and the charts this journey implements
- Compute job lifecycle: the engine's run, its logs and its exit code
- ores.compute.result
- ores.compute.workunit
- ores.compute.batch
- ores.compute.app_version
- ores.compute.app_version_platform
- ores.compute.platform
- ores.compute.host
- ores.telemetry.logs
- Tenant ownership and the information flow: the class of a node's logs, and why the control is withheld
- ores.compute
- User Journeys
- Journey execution
11. See also
- User Journey Extraction Standard: the checklist this journey is written against
- Task: Extract the ores.compute user journeys: the story that owns this work
- Operations journeys: the group that owns the logs screen