User Journey: Watch the grid
Table of Contents
This page documents a user journey: A signed-in person reads how much work the compute grid is carrying, how busy its nodes are, and how the load, the throughput and the outcomes moved over a time range.
A user journey describes what one person is trying to do, before anything is built. It is a design document that outlives any sprint, so it names the screens, the entity fields each screen shows, and the operations and messages each step needs.
1. Goal
"I want to know how much work the grid is carrying, and how that changed." The person picks a time range, last hour, last day or last week, and reads one screen. The screen states how much work is in flight and in what state, how many nodes are up and how busy each one was, how much work finished in each interval, how it finished, and whether the grid is keeping up with what it was given. The journey is done when the person can say whether the grid is busy, whether it is behind, and whether it is succeeding.
2. Actor and trigger
The actor is what the rows admit, and the session decides the rows. A member sees their own work, a tenant administrator sees their tenant's work, and the super administrator sees all of it. This is one journey, not three: the activity is the same "how much work is in flight" over three visible sets, and the database already knows which set applies. The journey does not split on the actor (Tenant ownership and the information flow).
Two kinds of row sit on the screen, and both belong to the installation. The fleet rows are the installation's: the nodes and their samples describe machines the installation owns, so every account the permission admits reads them whole. The work counts are the installation's own ledger: the service is already inside each tenant when it dispatches that tenant's work and when it takes the result back, so it records what it did as a fact about its own operation, and the counts do not narrow to a tenant. The tenant rows behind them, the workunits, batches and results, stay the tenant's, and the ledger carries the operation and not the tenant's content.
The trigger is work in flight: a batch was submitted, results are late, or somebody asks whether the grid is the reason. The person opens the load screen and chooses a range. The journey ends when the load over that range is accounted for.
This journey writes nothing. It reads stored samples and the current work rows. It changes no node and stops no job: that is control, use case 6 of Compute journeys, and it is deferred.
3. Steps
- Open the load screen and choose a range. The person opens the screen and picks last hour, last day or last week. The system answers over that range and draws every panel against one shared time axis, so a spike in one panel lines up with the same moment in the next. The poller keeps thirty days of samples, so all three ranges are answerable (ores.compute.grid_sample, ores.compute.node_sample).
- Read the load over time. The system draws how much work was in flight in each interval, stacked over the result states: inactive, unsent, in progress and done. The person sees the shape of the work, not one number, so a burst that drained and a burst still sitting unsent look different.
- Read the fleet. The system states how many nodes the grid has, how many were online and how many were idle, over the same axis. A fleet that shrinks explains a load that backs up.
- Read the node load heatmap. The system draws one row per node and one column per interval, coloured by the work that node did in that interval. Each row carries the node's name, its hostname and its display name. The person reads which node was hot and when, and whether the load spread evenly.
- Read the node state ribbon. Under the heatmap the system draws the same rows as bands over time: online, quiet or lost. The person reads which node went quiet and when, and whether that lines up with work that stopped finishing.
- Read throughput and outcomes. The system draws a bar per interval for the work that finished, and beside it a bar stacked over success, client error and no reply. The person reads whether the grid is keeping up and whether what it finishes is good.
- Read the queue depth. The system draws a line over the unsent and in-progress work. A line that climbs while throughput stays flat is a grid that is falling behind, and it is the first sign that a node is missing.
- Find the row that is the problem. Each node row carries a small trend of its own work, so the person spots the odd row in the table without reading the heatmap. The row opens the node's own view, which is out of this journey's scope.
- Read who is using the grid, on the Usage tab. The system draws the allocation by tenant from the installation's own ledger: what it observed about the work it dispatched, not a read across the tenants' tables. The person reads which tenant is using the grid without the screen entering any tenant.
- A grid with no history. The deployment is up but the range holds no samples, which is the state before the sampler's first pass or after a long stop. The screen says the range is empty and does not present a flat line at zero as a fact about the grid.
- Leave, or go on. The person leaves the screen, follows one node, or follows one job into Follow a job. The paths out are the related journeys at the foot of the screen.
4. Screens and wireframes
One screen, with a Load tab and a Usage tab. The range bar, the counters, the node load heatmap, the node state ribbon, the load over time, the fleet size, the throughput, the outcomes, the queue depth and the per-node table with its sparklines are panels of the Load tab; the allocation by tenant is the Usage tab. The person reads them as one answer. The screen is read-only: it creates nothing, changes nothing and destroys nothing.
The panels are the charts Compute journeys names for watching the grid, and each one answers one question:
| Panel | Chart | Answers |
|---|---|---|
| Load over time | Load over time | How much work is in flight, and of what sort? |
| Fleet counters | Fleet size | How many nodes do I have, and how many are up? |
| Node grid | Node load heatmap | Which node was hot, and when? |
| Node bands | Node state ribbon | Which node was quiet or lost? |
| Finishing bars | Throughput | How much is finishing? |
| Outcome bars | Outcomes | Is it succeeding? |
| Depth line | Queue depth | Is the grid keeping up? |
| Node table | Per-node sparklines | Which row of this table is the problem? |
| Usage tab | Allocation by tenant | Who is using the grid? |
The panels share one time axis and one range selector, and the heatmap is the same chart whether it is coloured by work, failures or bytes. The Usage tab reads the installation's own ledger rather than the fleet's samples, and it needs no tenant's rows.
Every list on the screen pages on the server, per the Record screen standard. The per-node table carries First, Previous, Next, Last, a page size and Load all, with the page and the page size held in the address. A new search, a new filter, a new order or a new page size returns to page one, and Load all is offered only when the server's total is 1000 or less. The table never reads with a fixed large limit, and it never pages to the end to show everything.
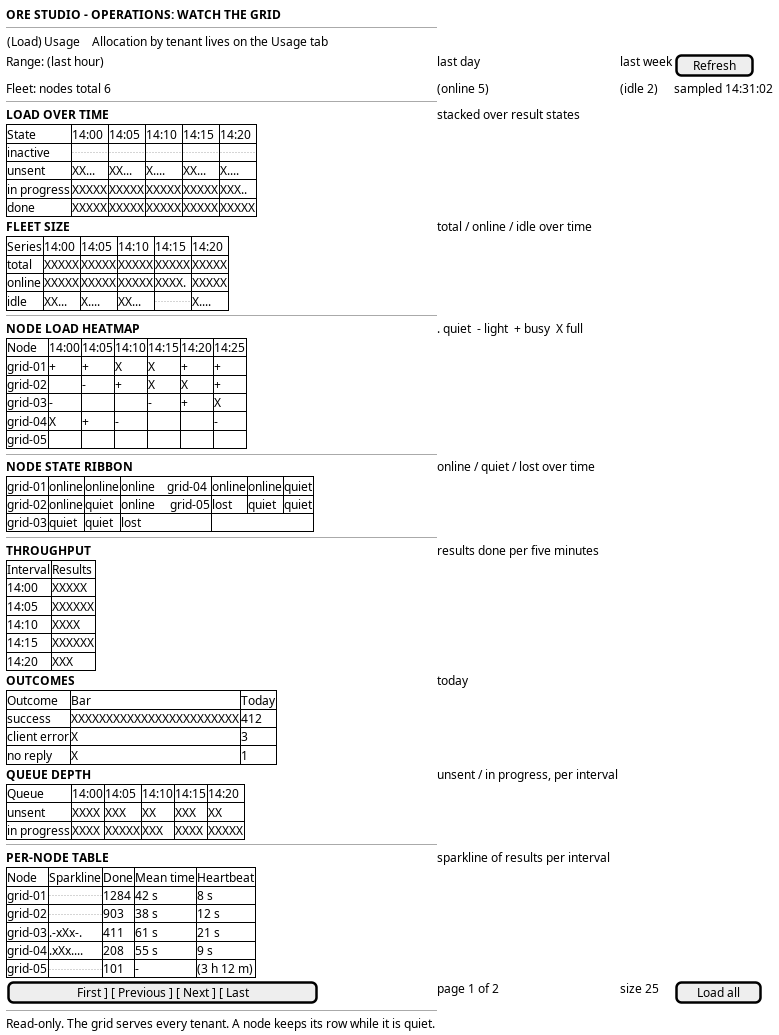
Figure 1: Watch the grid: the range bar, the fleet counters, the load over time, the node heatmap and ribbon, the throughput, outcomes and queue charts, the per-node table and the Usage tab.
5. Prototype
None. This journey is not built and has no clickable prototype. Its design record is the use-case analysis on Compute journeys, which states that a prototype of these screens with empty frames would not answer the question the walk is for, and that the charts must be drawn from mock series.
6. Entities composed
| Entity | What it contributes | Model |
|---|---|---|
grid_sample |
The work and host counters as one stored sample: states, batches, workunits and outcomes | ores.compute.grid_sample |
node_sample |
One node's work in one interval: tasks, mean and longest duration, bytes and seconds since heartbeat | ores.compute.node_sample |
host |
The node's name, hostname and capacity: external_id, display_name, cpu_count, ram_mb and gpu_type |
ores.compute.host |
result |
The execution attempt behind a state count, with its server_state, outcome, host_id and received_at |
ores.compute.result |
workunit |
The job behind a result: its batch_id, app_version_id and target_redundancy |
ores.compute.workunit |
batch |
The container behind a workunit, with its external_ref and status |
ores.compute.batch |
The heatmap and the ribbon need one row per node per interval. That is the
node_sample table: it is a TimescaleDB hypertable partitioned by sampled_at,
and its indexes are (host_id, sampled_at desc) and (tenant_id,
sampled_at desc). The counters need one row per interval, which is the same
shape on grid_sample.
A node with no matching host row shows its id and says no host names it. The
node sample carries no release, and the service heartbeat now carries both the
release and the host, so a join on the host id can say which wrapper build a
node ran. The heartbeat still carries no work, so the counts themselves come
from the node sample.
7. Operations and messages
| Step | Operation | Subject | Status |
|---|---|---|---|
| Before the screen: the service samples the grid on its interval | (no subject: an internal poller stores the sample) | none | exists |
| Before the screen: each wrapper reports its node's interval | Publish one node's sample | compute.v1.telemetry.node_samples |
exists |
| Open the screen and choose a range | Read the grid samples in the range | (no subject: the model generates no protocol) | missing |
| Read the node load heatmap, the ribbon and the sparklines | Read the node samples in the range, one series per node | (no subject: the model generates no protocol) | missing |
| Read the load, the fleet, the throughput, the outcomes and the queue depth | Read the grid samples in the range | (no subject: the model generates no protocol) | missing |
| Name the nodes | Join the host registry onto each node row | compute.v1.hosts.list |
exists |
| Read the newest sample alone | Read one stored grid sample and the newest node row | compute.v1.telemetry.get_grid_stats |
exists |
| Read the newest sample alone | Check the caller's permission | compute::grid_samples:read, checked by the handler |
exists |
| Refresh, or watch | Read the range again | (no subject) | missing |
compute.v1.telemetry.get_grid_stats carries no request fields and answers
with one stored grid sample and one node_stats_summary per node. It is the
only grid read there is, and it serves the newest row and nothing else, so it
cannot answer any panel above except the counters at the right-hand edge of the
axis.
Both sample models are declared internal: only the data layer and the SQL schema are generated, and neither has a protocol, a handler or a shell command. No subject exists to ask for a range of either table today.
compute.v1.telemetry.node_samples is ingested with auth none, because the
publishing wrapper has no session. Each wrapper publishes what its node did
since the previous sample, and the service writes the row.
The browser reads the panels through a hand-written BFF route on the journey runtime. No route serves a compute screen yet.
8. What is missing
- The grid read serves one tenant. The grid belongs to the installation: every tenant's work runs on the same hosts. The read filters by the session tenant anyway, so an administrator reads one tenant's slice of a shared grid and cannot tell it is short (The grid read is scoped to the session tenant). The read must serve the fleet whole, and the permission gate decides who may see it.
- The node summary drops the failure fields.
node_samplecarriestasks_failedandmax_task_duration_ms, andnode_stats_summarycarries neither, so a node failing every task reads as idle. The heatmap coloured by failures and the ribbon cannot state a node's failures until both fields reach the read (The node summary drops the failure fields). - A node has no state but its heartbeat age. The ribbon wants to state
online, quiet or lost, and only the first two can be derived from the age
of the node's newest sample. There is no draining state and no
maintenance flag on
host, so the deferred control of use case 6 has no row to set. - The installation's own ledger is not built. The work counts come from the
stored grid sample, whose totals
ores_compute_grid_stats_fncomputes for one tenant, so the stored summary is that tenant's slice rather than the installation's own accounting. The work totals table now holds the sum of every tenant's counters for a session of the system tenant, so the load panels read the whole grid. The finished work and the outcomes sit in the totals only as the last day's counts. The ledger the ownership study decides on records the operation as an installation fact and is still the missing piece (Tenant ownership and the information flow).
9. Related journeys
The fleet survey already has a journey. It is Watch the compute grid in the Operations group, and it covers the summary, the node table and the wrappers. This journey is the load: how much work is in flight, how busy the nodes were, and how that moved over time. It starts where the fleet survey stops, and it does not repeat it.
- Watch the compute grid: the fleet survey, meaning the summary, the node table and the wrappers, at the newest sample
- Follow a job: one job behind the work counts, end to end
- Diagnose and reproduce a failure: the failures in the outcome panel, one at a time
- Plan the grid's capacity: what the load needs next, against what the nodes have
- Keep what the grid runs: the apps, versions and packages behind the work
- See the running services: a flat load with every node quiet starts here
- Watch the message bus: a stalled bus explains work that never leaves
unsent - Read the telemetry logs: the lines behind a spike or a node that went quiet
10. Related knowledge
- Compute journeys: the use cases and the charts this journey implements
- ores.compute.telemetry: the grid and node sample messages
- ores.compute.grid_sample
- ores.compute.node_sample
- ores.compute.host
- ores.compute.result
- ores.compute.workunit
- ores.compute.batch
- ores.compute
- Compute job lifecycle: how a batch becomes workunits and results
- Tenant ownership and the information flow: which rows are the installation's and which are a tenant's
- Compute Grid Telemetry Design: the poller and the two hypertables
- User Journeys
- Journey execution
11. See also
- User Journey Extraction Standard: the checklist this journey is written against
- Task: Extract the ores.compute user journeys: the story that owns this work
- Operations journeys: the group that owns the fleet survey