User Journey: Follow a job
Table of Contents
This page documents a user journey: A signed-in person follows one compute job end to end: its state, the node it ran on, its timings, its inputs and outputs, and where its time went.
A user journey describes what one person is trying to do, before anything is built. It is a design document that outlives any sprint, so it names the screens, the entity fields each screen shows, and the operations and messages each step needs.
1. Goal
"I want to follow this job from submission to output." The person opens one batch or one job and reads one screen: the batch it belongs to, the job's state, the node it ran on, when it was dispatched and when its output arrived, the input bundle it read and the output archive it wrote. The journey is done when the person can say where this job is, what it is doing, and what it produced.
2. Actor and trigger
The actor is what the rows admit, and the session decides the rows. A member sees their own job, a tenant administrator sees their tenant's, and the super administrator sees every job. This is one journey: the activity is the same "where is this job" over three visible sets, and permissions and row-level security already describe the sets, so the journey does not split on the actor.
The rows are a tenant's. Workunits, batches and results belong to the tenant that owns them, so every read here narrows to the session's tenant. A super administrator who wants another tenant's job reaches it by acting inside that tenant, not by widening a policy (Tenant ownership and the information flow).
The trigger is a job the person cares about: a result they are waiting for, a batch that looks stuck, or a job whose output a report needs. The person opens the screen from a batch reference, a job id or a result id. The journey ends when the job's state, its node, its times and its files are all accounted for.
This journey writes nothing. It reads the job's rows, the node registry and the current samples. It does not cancel, requeue or re-run anything: that is control, and it is deferred.
3. Steps
- Find the job. The person opens the screen and gives a batch reference, a
job id or a result id, or reads the batch's own list. The system answers with
the job, its batch and the runs of that job. A batch carries its
external_refand itsstatus, and a job is aworkunitof that batch. - Read the state. The system states where the job is. The workunit has no
status column: a job with no
canonical_result_idis not done, and one with it is. Each run of the job is aresultwith its ownserver_state, which is 1 Inactive, 2 Unsent, 4 InProgress or 5 Done, and its ownoutcome, which is 1 Success, 3 ClientError or 4 NoReply (Compute job lifecycle). - Read the node. The system names the node each finished run ran on, from
the
host_idthe submit recorded, and joins the host'sexternal_idanddisplay_nameso the person reads a name and not an id. A run that has not finished may show no node yet: the dispatcher creates the result without one and the submit binds it (ores.compute.host, ores.compute.result). - Read the timings. The system states when the batch was dispatched, when
the run's row was written, and when its output was received. The run's
recorded_atis when the dispatcher wrote it andreceived_atis when the output arrived, so the two bracket the run. - Read the inputs and outputs. The system states the input bundle the job
read, from the workunit's
input_uriandconfig_uri, and the output archive it wrote, from the result'soutput_uri. The person can take either away: the input with the shell's download-input command and the output with download-output (How do I download a compute job input from the shell?). - Read where the time went. The system draws one bar for the run, from its dispatch to its output, and splits the batch's jobs into one row each, so the person sees which jobs overlapped and which waited. Inside the bar the system can show only what it stores: a node took the job, the engine ran for the time the node reports, and the output arrived. The rest of that span is the download of the input and the upload of the output, not timed apart, and the waterfall says so rather than draw a guessed split. A run that predates the start time shows its two stored times only.
- Read the release that ran it. The system states the workunit's
app_version_idand, through it, the app'sengine_versionand thewrapper_version. This is the release the job runs: the version of ORE behind the work, written on the workunit when the job was stored, so a job that behaved differently from its neighbours can be told apart by its build. It is also the answer about this job rather than about the machine. The wrapper heartbeat carries the wrapper's release and the host, so the build a node runs is known; the node sample carries the host and no release. Neither names the app version the job pinned, so the job's ownapp_version_idis the fact about the work rather than an inference from the machine that happened to run it (ores.compute.app_version). Follow the lineage. The system draws the chain that put this job on the grid: the scheduled job, the report definition, the report run, the batch, the workunit and the result. The selected job is the highlighted workunit, and its siblings in the same batch stay visible beside it, so the person reads what this job belongs to and what else the batch carried. The flow chart is one column of nodes, top to bottom:
scheduler.job_definition      the job the scheduler fires
  └─ report_definition        scheduler_job_id
       └─ report_instance     definition_id, trigger_run_id
            └─ batch          external_ref = report instance id
                 ├─ workunit   batch_id  ← the selected job
                 │    └─ result   workunit_id, outcome
                 ├─ workunit   batch_id  ← a sibling
                 │    └─ result   workunit_id, outcome
                 └─ workunit   batch_id  ← a sibling
                      └─ result   workunit_id, outcome
Every hop is stored except the batch's link to the report run, which is the batch's
external_refand not a checked relationship; What is missing states that. A shell-dispatched batch carries an operator string inexternal_refand has no report behind it, and the screen must say so rather than draw an empty report.- Compare the job with its neighbours. The system draws the batch's jobs as a timeline, and, when the range holds enough neighbours, a duration distribution and a duration by node. The person asks whether this job is normal, whether one node is slow, and whether the batch is nearly done.
- No such job. The reference matches nothing, the job belongs to another tenant, or the person's rows do not include it. The screen says so and offers the way back to the batch list. It does not present the empty answer as a job with no state.
- Leave, or go on. A failed run continues in Diagnose and reproduce a failure, where the error and the node's logs are read. The load the job sat in continues in Watch the grid.
4. Screens and wireframes
One screen. The finder bar, the job header, the run table, the timeline, the lineage chart, the duration charts and the file panel are panels of that screen, because the person reads them as one answer. The screen is read-only: it creates nothing, changes nothing and destroys nothing.
The panels are the charts Compute journeys names for following a job:
| Panel | Chart | Answers |
|---|---|---|
| Batch rows | Job timeline | What ran when, and what overlapped? |
| Run bar | Job waterfall | Where did this job's time go? |
| Distribution | Duration distribution | Is this job normal? |
| Node comparison | Duration by node | Is one node slow? |
| Lineage | Job lineage | What report caused this job, and what ran with it? |
The timeline is the cluster Gantt: one row per job of the batch, a bar per run. The waterfall is the one job's own bar, split by phase as far as the stored times allow. The lineage chart is the chain from the scheduled job to the results, with the selected job's workunit highlighted and its batch siblings beside it; this screen owns the chart, and Diagnose and reproduce a failure reuses it. The two duration charts compare the job with its neighbours, and they need a range of finished runs to say anything.
Every list on the screen pages on the server, per the Record screen standard. The batch rows, the run table and the lineage's workunit list each carry First, Previous, Next, Last, a page size and Load all, with the page and the page size held in the address. A new search, a new filter, a new order or a new page size returns to page one, and Load all is offered only when the server's total is 1000 or less. No list reads with a fixed large limit, and none pages to the end to show everything.
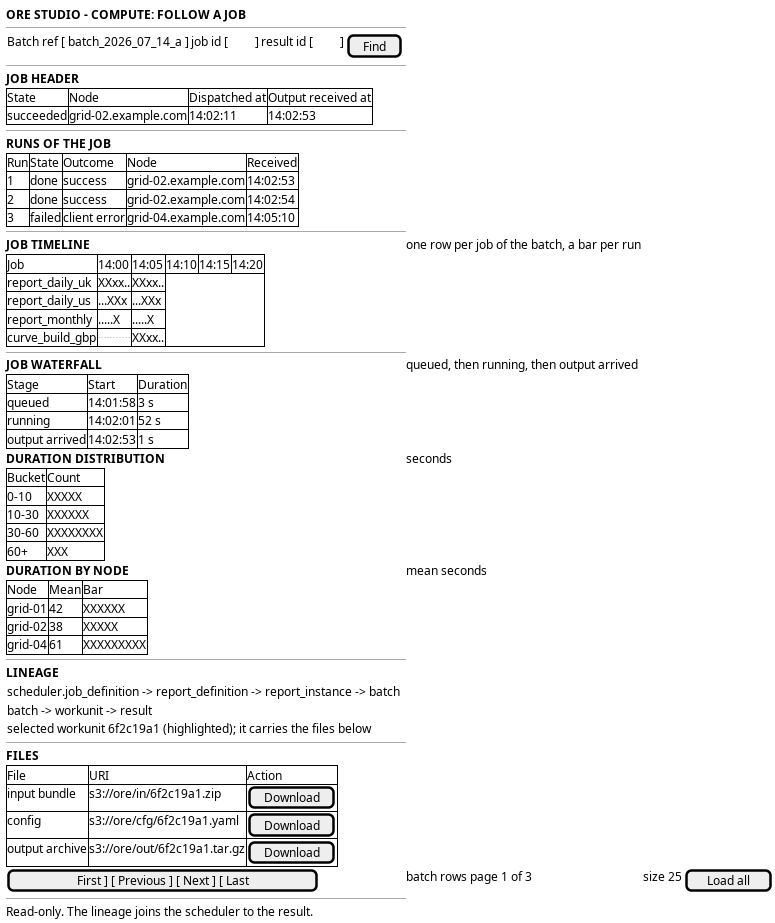
Figure 1: Follow a job: the finder bar, the job header, the run table, the timeline, the lineage chart, the duration charts and the file panel.
5. Prototype
A static prototype argues the job page: the state with the outcome beside it, the runs, the files, the release and the lineage, for the three roles and the four states. It leaves out the duration charts and the phase waterfall, which no stored field feeds.
- Source
doc/prototypes/compute/follow-a-job/- Open
index.html, with?role=operator|tenant|member,?state=loaded|loading|empty|error|refused,?job=done|failed|runningand?origin=report|shell
The App Version ID on the job page opens the page of that version, which
doc/prototypes/compute/app-version/ draws and
Keep what the grid runs owns.
The use-case analysis on Compute journeys stays the design record for the charts the prototype leaves out.
6. Entities composed
| Entity | What it contributes | Model |
|---|---|---|
batch |
The container the job belongs to: external_ref and status |
ores.compute.batch |
workunit |
The job: batch_id, app_version_id, input_uri, config_uri, priority, target_redundancy and canonical_result_id |
ores.compute.workunit |
result |
One run of the job: workunit_id, host_id, server_state, outcome, output_uri, error_message and received_at |
ores.compute.result |
host |
The node a run ran on: external_id, display_name, cpu_count, ram_mb and gpu_type |
ores.compute.host |
app_version |
The wrapper and engine build the job used: wrapper_version and engine_version |
ores.compute.app_version |
report_definition |
The report whose run submitted the batch: scheduler_job_id |
ores.reporting.report_definition |
report_instance |
One run of that definition: definition_id and trigger_run_id |
ores.reporting.report_instance |
job_definition |
The scheduled job that fired the run: job_name and schedule_expression |
ores.scheduler.job_definition |
node_sample |
A node's work in an interval, for the duration comparison: tasks_since_last, avg_task_duration_ms and max_task_duration_ms |
ores.compute.node_sample |
The job's identity is the workunit's id. The runs are the results that carry
that workunit_id, and the run that counted is the workunit's
canonical_result_id. A job with target_redundancy above one has several
runs, and the timeline shows them as one row's bars.
The lineage chain is stored hop by hop. The report definition names its
scheduler job in scheduler_job_id, and the report run names its definition in
definition_id and the firing in trigger_run_id, which is the scheduler job
instance's id. The run the scheduler fired is joined to its definition through
the job's action payload, which names the definition
(Report definition and schedule).
The batch names the report run in its external_ref, which the submit handler
writes as the report instance's id, and the workunits name the batch in
batch_id. The last two hops are confirmed in
Compute job lifecycle. The
batch-to-run hop is the one the model does not state as a relationship; see
What is missing.
The duration charts read node_sample, which describes a node's interval and
not a result. Its avg_task_duration_ms and max_task_duration_ms are means
and maxima over the tasks of that interval, so a chart built on them compares
nodes rather than following one job. The result itself carries no duration.
7. Operations and messages
| Step | Operation | Subject | Status |
|---|---|---|---|
| Before the screen: a batch is dispatched | Publish one assignment per job | compute.v1.work.assignments |
exists |
| Find the job | Read the batches a person may see | compute.v1.batches.list |
exists |
| Find the job | Read one batch by its reference | compute.v1.batches.get |
exists |
| Read the state | Read the jobs of the batch | compute.v1.workunits.list_by_batch_id |
exists |
| Read the state | Read one job | compute.v1.workunits.get |
exists |
| Read the state and the timings | Read the runs of the job | compute.v1.results.list_by_workunit_id |
exists |
| Read the state and the timings | Read one run | compute.v1.results.get |
exists |
| Read the node | Read the host registry | compute.v1.hosts.list |
exists |
| Read the node | Read one host | compute.v1.hosts.get |
exists |
| Read the release that ran it | Read the app versions | compute.v1.app_versions.list |
exists |
| Follow the lineage | Read the report definition and the run behind the batch | reporting.v1.report_definitions.get, reporting.v1.report_instances.get |
exists |
| Follow the lineage | Read the scheduled job that fired the run | scheduler.v1.status |
exists |
| Follow the lineage | Read the batch whose external_ref is the report run |
compute.v1.batches.get |
exists |
| Follow the lineage | Read the scheduler job instance behind the run | (a paged list only, with no read by id) | missing |
| Follow the lineage | Read the batches linked to a report run | (no read lists batches by external_ref) |
missing |
| Read the waterfall phases | Read the per-phase times of one run | (no field on any row) | missing |
| Read the duration charts | Read the per-result durations over a range | (no field on any row) | missing |
| Find the job across tenants | Read another tenant's jobs as that tenant | (token exchange, not built here) | missing |
| Refresh | Read the job again | (the reads above) | exists |
Every read above is generated from an entity model and carries its subject. The
workunit read carries a list_by_batch_id variant, and the result read carries
a list_by_workunit_id variant, so the batch, its jobs and their runs are
three reads that line up by id.
Each of these reads is gated by a permission. The generated handler
authenticates the token, checks the entity's read code
(compute::batches:read, compute::workunits:read or
compute::results:read), and serves the session's tenant, with the row-level
policy doing the narrowing. The dedicated codes the seed holds are the ones the
handlers check.
The browser reads the screen through a hand-written BFF route on the journey runtime. No route serves a compute screen yet.
8. What is missing
- A tenant cannot list its own jobs. The reads exist, but no journey and no screen carry them, so the tenant administrator's question "what is my tenant running?" has no answer today. The operations grid screen is the system administrator's and shows the installation. This journey is the missing screen (A tenant cannot list its own jobs).
- Per-phase times are partly recorded. The waterfall wants queued, dispatched,
downloaded, running, uploaded and validated. The result now carries
started_at, the server's clock when a node took the run, andduration_ms, how long the engine ran by the node's clock. Withreceived_atthey split the run into the engine's time and the rest: the download, the upload and the hand back. The wait before the claim is not on the current row, because the row is rewritten when the run ends, and the download and the upload are not timed apart. Their timestamps from the wrapper are the missing piece. A run that predates the columns has no start, and reads as unknown. - Each result carries a duration, and the charts still have little to compare. The
result now states how long the engine ran. The duration distribution and duration by
node charts can place this job among its neighbours once enough runs carry the
value.
node_samplestill carries interval means and maxima, not per-result values. - A run in flight may show no node. On the JetStream path the dispatcher
creates the result without a
host_idand the submit binds it at the end, so the node is known only when the run is done. The screen must say the node is not yet known rather than leave the field blank. - The workunit has no status. Its state is derived from
canonical_result_id, so a job that has run and failed reads as done, which is correct for the grid and surprising for a person. The screen must show the run'soutcomebeside it, and acceptance does not filter by outcome (Compute job lifecycle). - A batch's canonical runs may all have failed. Acceptance moves the batch
to
closedeven when every canonical result failed, so a closed batch is not a successful batch. The screen must state the outcomes and not equate closure with success. - The node summary drops the failure fields. A job's own outcome is on the result, so the job view is complete, but the neighbouring node comparison cannot state a node's failures (The node summary drops the failure fields).
- The batch names its report run in a text field, not a relationship. The
submit handler writes the report instance's id into
batch.external_ref, so the hop from a job back to its report is real in the implementation. It is not in the model: the compute batch model describesexternal_refas "the originating finance system or project" and states no link to a report run, and no read lists batches byexternal_ref.compute.v1.batches.getresolves one batch once the report run's id is known, and the reverse question, "which jobs does this report have", has no subject. A report instance id on the batch, or a batch filter onexternal_ref, is the missing piece (ores.compute.batch). - The report run names neither its batch nor its workflow instance.
report_instancecarriesdefinition_idandtrigger_run_idand nobatch_id, so the run cannot state what it produced. Report definition and schedule places "the workflow instance that ran" on the instance, and the model has no such column; the workflow instance id is carried in the run's start message and read throughworkflow.v1.instances.list. A run that named its batch would let the lineage be read from the report end without theexternal_refconvention (ores.reporting.report_instance). - The scheduler firing is recorded but not readable by id. The report run's
trigger_run_idis the scheduler job instance's id, and the only scheduler instance read is the pagedscheduler.v1.job-instances.list; no read returns one instance by id, and thejob_instancetable has no generated entity model. The lineage reaches the scheduled job through the definition'sscheduler_job_id, which is cleared when the definition is suspended or archived, so a run whose definition has since been paused loses its live schedule link (ores.scheduler.scheduling_operations). - The bridge row is not a lineage.
workflow_batch_linknames the batch, the workflow step and the workflow instance, and the bridge deletes the row when the batch reaches a terminal state. It is a live note that a step is waiting, not a durable link, and it names a workflow step rather than a report run, so the lineage chart cannot be built on it (ores.compute.workflow_batch_link).
9. Related journeys
- Watch the grid: the load this job sat in, over a range
- Browse the grid's jobs: find this job in the tree of batches, workunits and results
- Diagnose and reproduce a failure: a run of this job that failed, and how to run it again
- Plan the grid's capacity: the queue this job waited in and what comes behind it
- Keep what the grid runs: the app version this job pinned
- Watch the compute grid: the node this job ran on, in the fleet survey
- Read the telemetry logs: the lines a run published, found by its result id
- Watch the message bus: a job stuck unsent because the assignment never reached a node
10. Related knowledge
- Compute journeys: the use cases and the charts this journey implements
- Compute job lifecycle: the six stages, the states and the storage keys
- ores.compute.batch
- ores.compute.workunit
- ores.compute.result
- ores.compute.host
- ores.compute.app_version
- ores.compute.node_sample
- ores.compute
- Tenant ownership and the information flow
- User Journeys
- Journey execution
11. See also
- User Journey Extraction Standard: the checklist this journey is written against
- Task: Extract the ores.compute user journeys: the story that owns this work
- Operations journeys: where the fleet survey lives